Fig. 5.
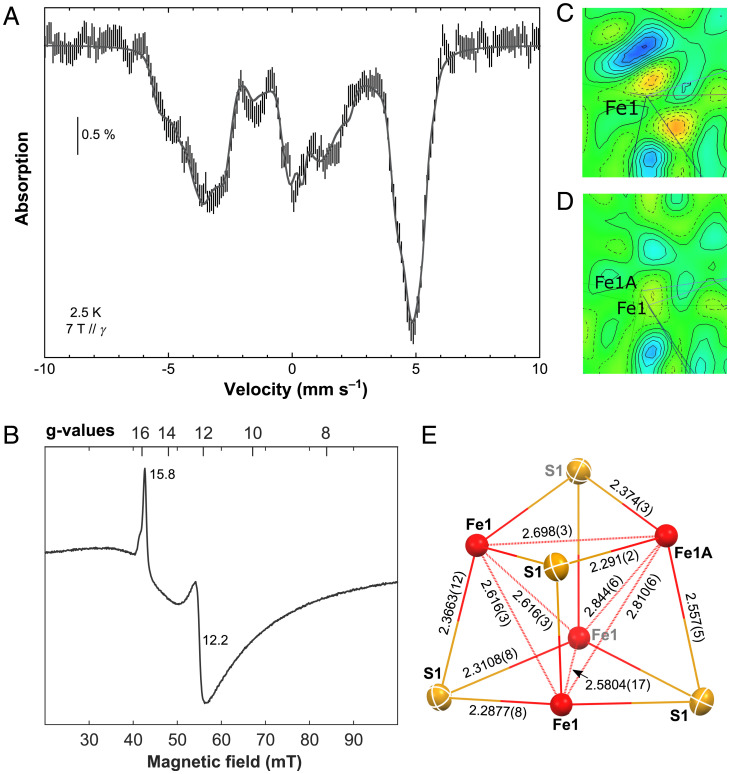
Spectroscopic and structural data for 3. (A) 2.5 K Mössbauer spectrum recorded on a powder sample of 3 using a 7-T external magnetic field applied parallel to the γ-beam (hatched bars). A simulation is overlaid as a gray solid line, and the corresponding list of parameters is given in SI Appendix, Table S3. (B) Low-field region of the parallel-mode EPR spectrum of a 10-mM frozen toluene/cyclohexane (9:1) solution of 3 recorded at 6 K. (C, D) Difference electron density map (–0.74 e/Å3 (red) to 0.751 e/Å3 (blue); iso-values in increments of 0.1147 e/Å3) of a mean plane through the Fe1-position before (C) and after (D) applying the split model, highlighting the smoothing of the residual electron density upon refining the disorder. (E) Solid-state molecular structure of the Fe4S4 unit in 3 at 100 K, containing three symmetry equivalent iron-atoms (Fe1 site with an occupancy of 0.797(8)) and one iron atom of the Fe1A site with an occupancy of 0.203(8). The disorder described by the split model corresponds to a superposition of this locally ordered unit in four different orientations. Distances are given in angstroms.

