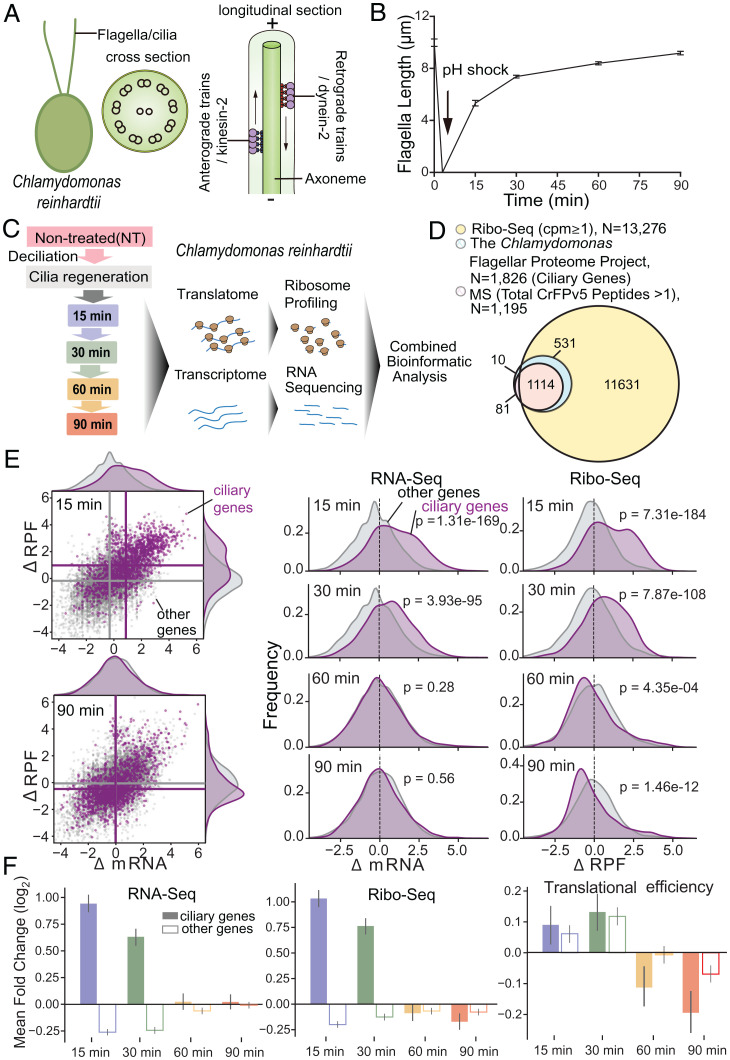
Fig. 1.
Flagellar gene transcription and translation during regeneration. (A) The structure of Chlamydomonas flagella. The cross-section shows one central pair of MTs surrounded by nine outer MT doublets organized in a circle which is termed axoneme. The longitude section shows the selective import and transport of ciliary proteins out to the tip are mediated by intraflagellar transport (IFT), which is a molecular motor-driven process. As eukaryotic flagella are essentially identical organelles to cilia, the terms cilia and flagella are often used interchangeably. (B) The kinetics of flagellar regeneration in a population of C. reinhardtii. (C) Schematic overview of the experimental approach. The samples used for quantification in B are the same for ribosome profiling. (D) The Venn diagram shows the overlap between ciliary genes [from Chlamydomonas Flagellar Proteome (7), chlamyfp.org] and detected genes by Ribo-Seq or MS. (E) Right: Scatter plots show log2-fold change of RPFs (y-axis) and mRNA (x-axis) at 15 and 90 min after flagellar regeneration (30- and 60-min data are shown in SI Appendix, Fig. S2). Ciliary genes are in purple; other genes are in gray. Mean values per group are indicated as lines. Left: Kernel density estimate (KDE) plots show the distribution of log2-fold change of mRNA and RPFs at 15, 30, 60, and 90 min after flagellar regeneration. (F) The mean log2-fold change (P value is shown in SI Appendix, Fig. S2) of RNA-Seq (Left), Ribo-Seq (Middle), and translational efficiency (Right) at 15 (blue), 30 (green), 60 (orange), and 90 (red) min after flagellar regeneration for ciliary genes (solid bars) and detected genes other than ciliary genes (hollow bars).

