Fig. 5.
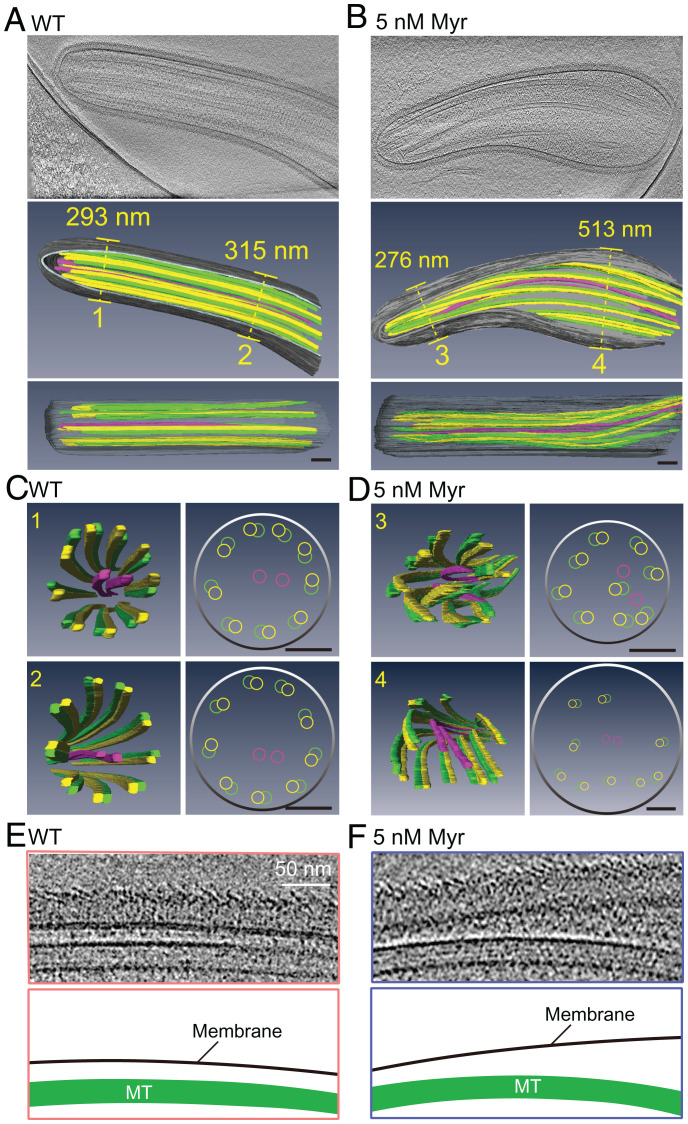
Ceramide loss disrupted the membrane–axoneme interaction. (A–D) Longitudinal (A and B) and cross-section (C and D) cryo-ET analysis of the cilia in WT and cell treated by 5 Nm Myr. Representative images of flagella longitudinal sections in A and B and cross-sections in C and D (Movies S1 and S2). (Scale bars, 100 nm.) (E and F) Magnified views of longitudinal section cryo-ET micrographs and the model below (Movies S1 and S2). (Scale bar, 50 nm.)

