Fig. 7.
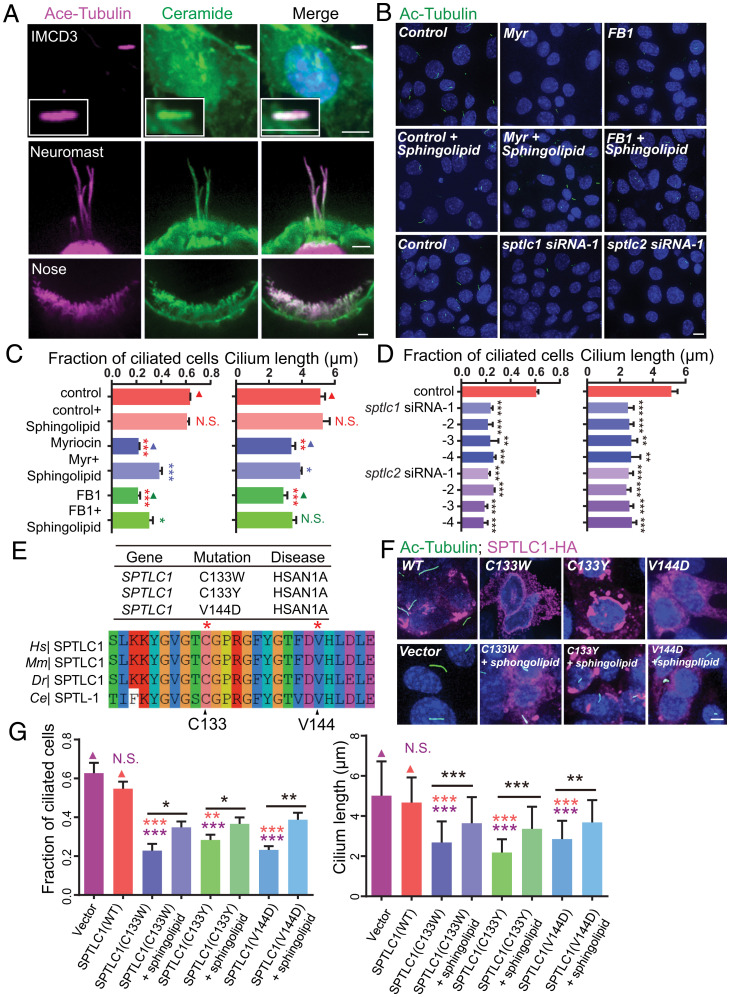
Roles of ceramide in mouse and zebrafish cilia. (A) Colocalization of ceramide and acetylated tubulin immunofluorescence in cilia of mouse IMCD3 epithelial cells and zebrafish lateral line neuromasts (rosette-like sensory organs that detect directional water flow) and olfactory placode (nose, the lateral edge of the anterior neural plate) (magenta, acetylated tubulin; green, ceramide; blue, DAPI). (Scale bar, 5 μm.) (B) Representative immunocytochemistry images in IMCD3 cells treated with ceramide biosynthesis inhibitors (5 μM myriocin, 10 μM FB1) with or without exogenous 10 μM sphingolipid mixture [sphingolipid mix contains sphingosine (C17 base), sphinganine (C17 base), sphingosine-1-P (C17 base), sphinganine-1-P (C17 base), lactosyl(β) C12 ceramide, 12:0 sphingomyelin, glucosyl(β) C12 ceramide, 12:0 ceramide, and 12:0 ceramide-1-P] or transferred with sptlc1 or sptlc2 siRNA (green, acetylated tubulin; blue, DAPI) for 48 h. (Scale bar, 5 μm.) (C) Quantifications in IMCD3 cells treated with ceramide biosynthesis inhibitors (5 μM myriocin, 10 μM FB1) with or without exogenous 10 μM sphingolipid mixture. n = 161 to 179 cells from three independent experiments. Values are the mean ± SD combined cell populations. Statistical significance was calculated by the Student’s t test using the means of biological replicates: *P < 0.05; **P < 0.01; ***P < 0.001; and N.S., not significant. (D) Quantifications in IMCD3 cells transferred with sptlc1 or sptlc2 siRNA. n = 115 to 200 cells from three independent experiments. Values are the mean ± SD combined cell populations. Statistical significance was calculated by the Student’s t test using the means of biological replicates: **P < 0.01 and ***P < 0.001. (E) Alignment of sequences flanking the dominant human diseases-associated residue C133 and V144 in SPTLC1. (F) Representative immunocytochemistry images in IMCD3 cells transfected with SPTLC1 related mutants (green, acetylated tubulin; magenta, SPTLC1; blue, DAPI). (Scale bar, 5 μm.) (G) Quantifications in IMCD3 cells transfected with SPTLC1-related mutants. n = 90 to 120 cells from three independent experiments. Values are the mean ± SD combined cell populations. Statistical significance was calculated by the Student’s t test using the means of biological replicates: *P < 0.05; **P < 0.01; ***P < 0.001; and N.S., not significant.

