
Figure 1.
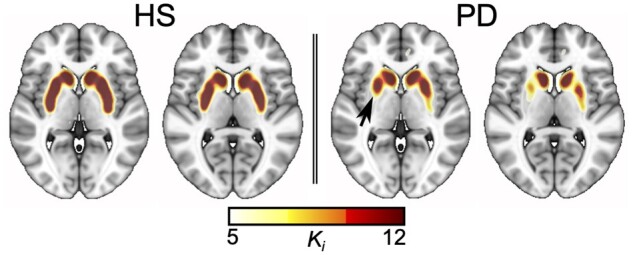
Representative Ki map for a healthy subject and a de novo Parkinson’s disease patient. Characteristically predominant reduction in 18F-DOPA uptake rate in the caudal putamen contralateral to the most affected clinical side is highlighted with a black arrow.