
Figure 3.
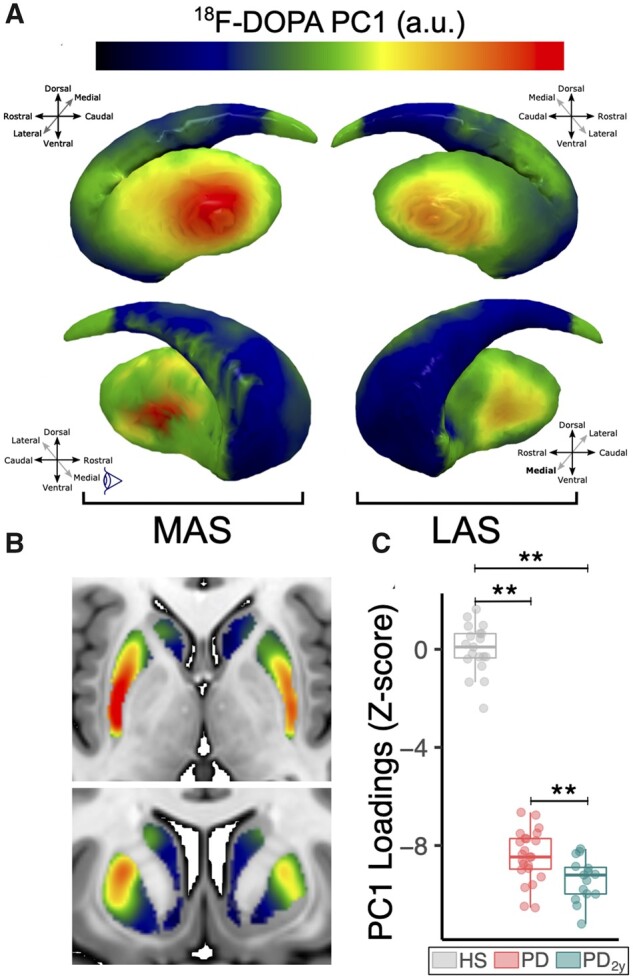
Spatial covariance analysis. (A) Representation of the extracted covariance pattern overlaid onto the striatal surface from lateral and medial angle views showing the focal onset of denervation in the posterolateral putamen in both the more-affected and less-affected sides. (B) Two-dimensional axial and coronal slices of the pattern overlaid onto the MNI space T1-weighted template emphasizes the observed intensity gradients in rostrocaudal and mediolateral axes. (C) Box plot representation showing subject pattern expression values for the described bilateral striatum pattern, which shows significant discrimination between HS and Parkinson’s disease groups and is sensitive to progression at 2 years (**P < 0.001 after non-parametric Mann–Whitney U-test). Box plot and individual values are represented in grey for HS, red for Parkinson’s disease at baseline and green for Parkinson’s disease at 2-year follow-up.