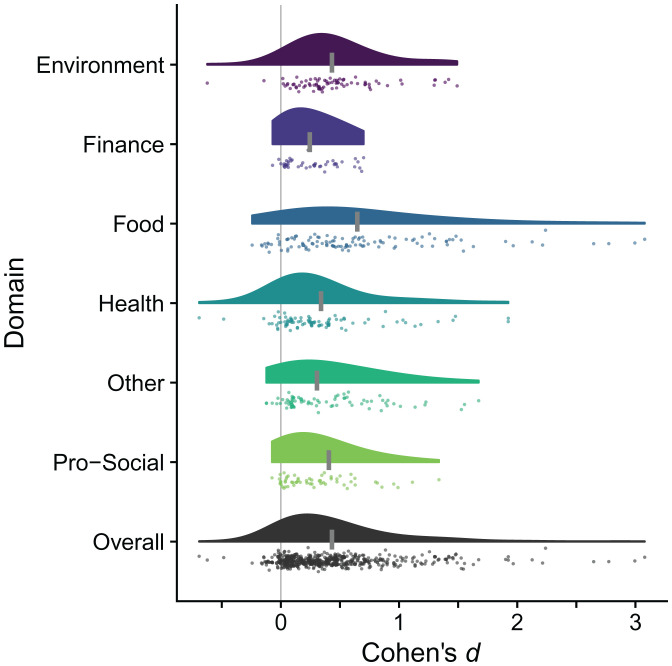
Fig. 1.
Raincloud plots of individual effects by domain and all effects. The rain is the reported effects from papers, jittered vertically, and the cloud is the smoothed distribution of effects. The short, wide, vertical gray lines on each cloud depict the corresponding meta-analytic mean. The single tall thin vertical gray line is an effect size of zero.

