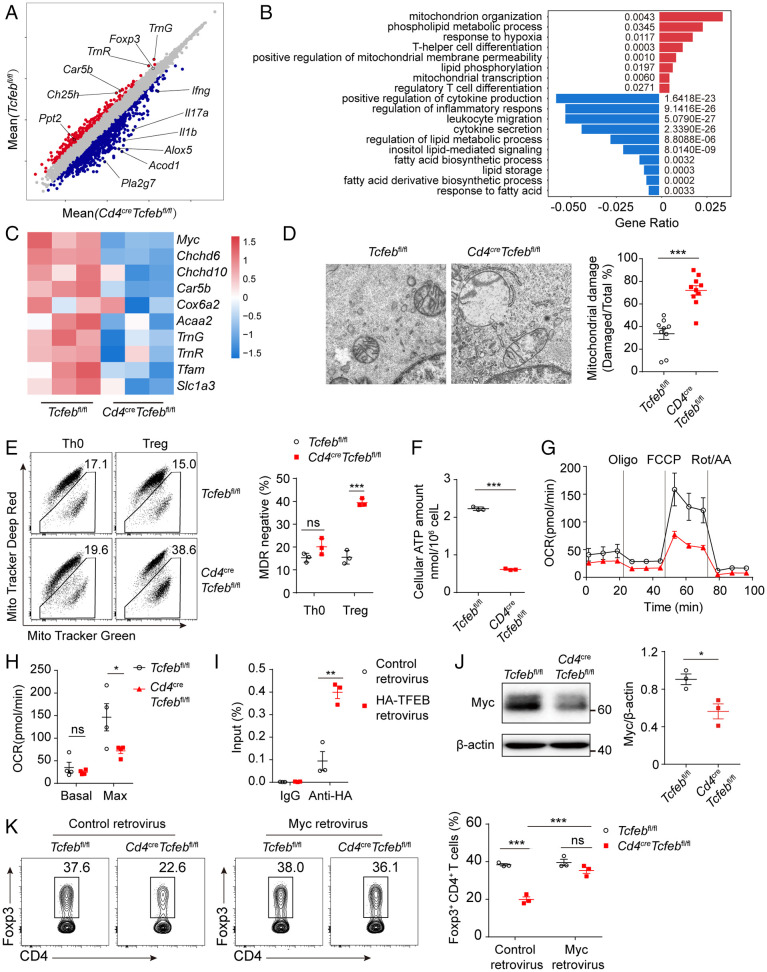
Fig. 6.
TFEB regulates mitochondria integrity and metabolism in Treg cells. (A–C) RNA-seq analysis of WT or Tcfeb-deficient naïve CD4+ T cells differentiated under Treg condition for 60 h. (A) Volcano plot showing differentially expressed genes between the two groups (n = 3). Each red or blue dot denotes a differentially expressed gene with fold change >2. (B) Gene ontology analysis of pathways in differentially expressed genes. (C) Heatmap showing the expression patterns of mitochondria related genes in Treg cells. The color density indicates the expression of genes, each row was scaled by z-score. (D) Representative electron microscope images (Left) and quantitative percentages (Right) of damaged mitochondrial cristae structure. (E) Representative flow cytometry plots (Left) of MitoTracker Green and MitoTracker Deep Red and frequencies of MitoTracker Deep Red in WT and TFEB-deficient Th0 and Treg cells (Right). (F) The amounts of intracellular ATP were determined by luminescent ATP detection assay. (G and H) A representative plot of oxygen consumption rate (OCR) and respective basal and maximal (after FCCP addition) respiratory activity of WT and Tcfeb-deficient Treg cells were shown. (I) The occupancies of TFEB in the Myc promoter were determined by chromatin immunoprecipitation. (J) Immunoblot analysis and quantitative results of Myc expression of in vitro differentiated Treg cells from Tcfebfl/fl and Cd4CreTcfebfl/fl mice. (K) Activated CD4+ T cells were transduced with control retrovirus or Myc retrovirus and differentiated under Treg conditions. Representative flow cytometry plots (Left) and frequencies (Right) of CD4+Foxp3+ Treg cells were shown. ns, no significance; *P < 0.05; **P < 0.01. Data are representative of three (A, B, C, J) or two (E, G, H, I, K) experiments. Data are means ± SEM and were analyzed by two-tailed, unpaired Student’s t test (D–J) and two-way ANOVA (K).

