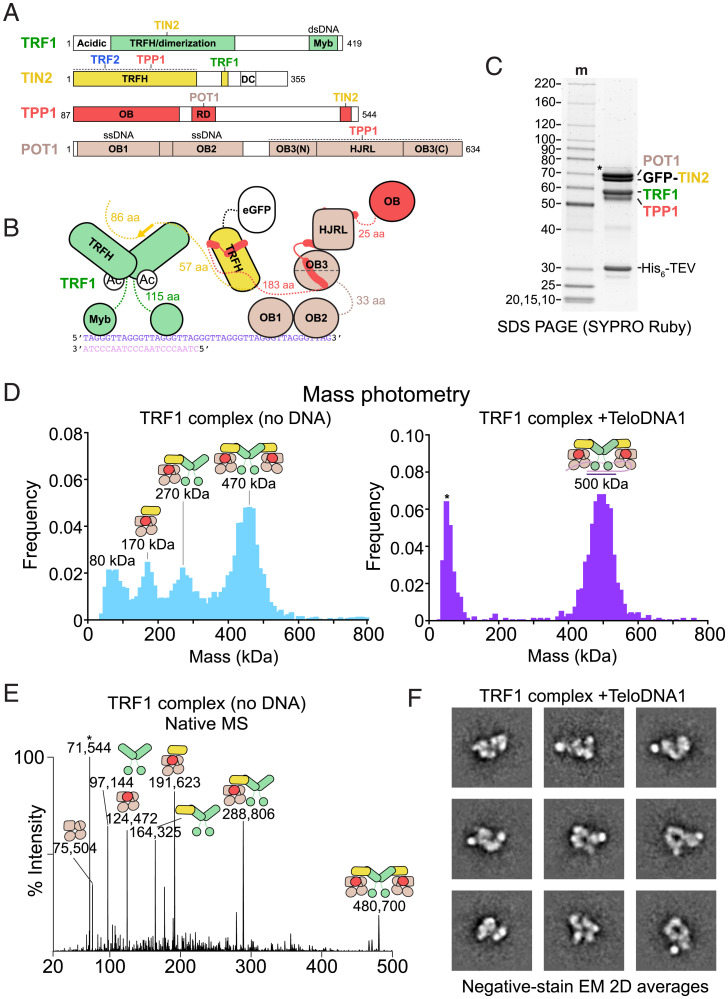
Fig. 3.
Structural heterogeneity within the TRF1 complex. (A) Domain schematics for POT1, TPP1, TIN2, and TRF1 with amino acids indicated. (B) Cartoon schematic for POT1/TPP1/GFP-TIN2/TRF1 bound to a ds–ssDNA junction. (C) Purified POT1/TPP1/GFP-TIN2/TRF1 prior to glycerol-gradient purification fractionated on SDS-PAGE. Protein gel as in Fig. 1B. (D) Mass photometry of TRF1 complex purified in the presence or absence of ds–ss junction telomeric DNA (TeloDNA1). Peak maxima are indicated along with cartoons that correspond to complexes of that molecular mass to within 10%. (E) Native MS analysis of reconstituted TS-POT1/TPP1/GFP-TIN2/TRF1. The measured masses (in Da) are indicated along with cartoons that correspond to complexes of that approximate molecular mass to within 0.08%. The asterisk indicates a species that likely corresponds to HSP70 contamination. (F) Negative-stain EM analysis of POT1/TPP1/GFP-TIN2/TRF1 bound to TeloDNA1. Reference-free 2D class averages showing a high signal-to-noise ratio were selected for display.

