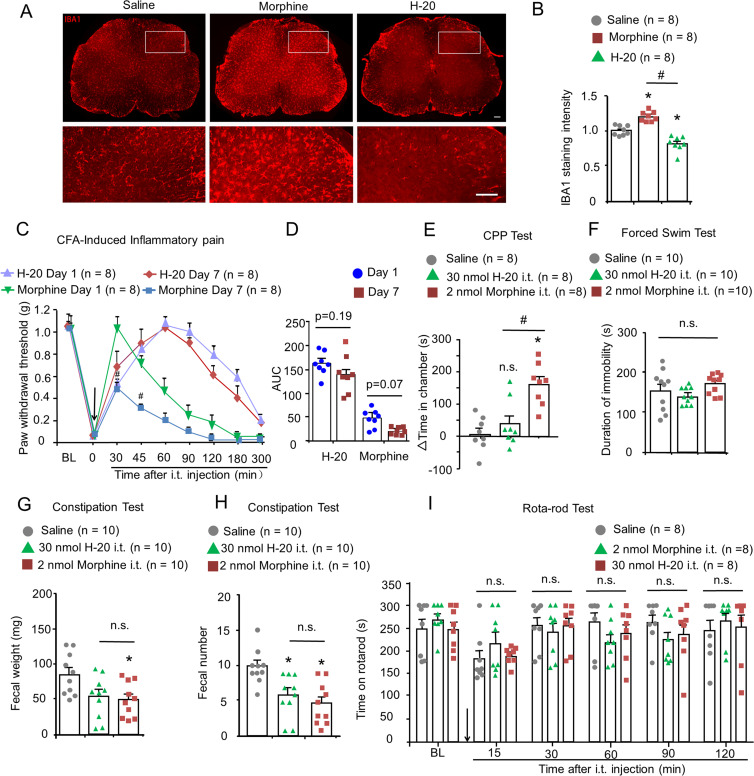
Fig. 4.
Adverse effects evaluation of spinal H-20 in mice. (A) The expression of microglial in spinal cord after repeated i.t. H-20 (30 nmol)/morphine (2 nmol) for 7 continuous days. (Scale, 50 μm.) (B) Quantification of IBA1-integrated intensity. Mean ± SEM *P < 0.05, versus saline group. #P < 0.05, versus morphine group. Four mice per group, eight images per group. One-way ANOVA. (C) Antinociception of i.t. repeated H-20 (30 nmol) or morphine (20 nmol) in CFA model. Mean ± SEM 8 mice per group. #P < 0.05, versus day 1. Three-way RM ANOVA. (D) The AUC values of H-20 and morphine on days 1 and 7. Two-way ANOVA. (E) Effect of repeated i.t. H-20 and morphine on CPP test. Mean ± SEM, 8 per group. *P < 0.05, versus saline group. #P < 0.05, versus morphine group. n.s., no significance. One-way ANOVA. (F) Effect of i.t. H-20 and morphine on the immobility time in the forced swim test. Mean ± SEM, 10 mice per group, n.s., no significance. One-way ANOVA. (G and H) Effect of i.t. H-20 and morphine on gastrointestinal function. Mean ± SEM, 10 mice per group. *P < 0.05, versus saline group. n.s., no significance. One-way ANOVA. (I) Effects of i.t. H-20 and morphine on motor coordination in mice. Mean ± SEM, 8 mice per group. n.s., no significance. Two-way RM ANOVA.

