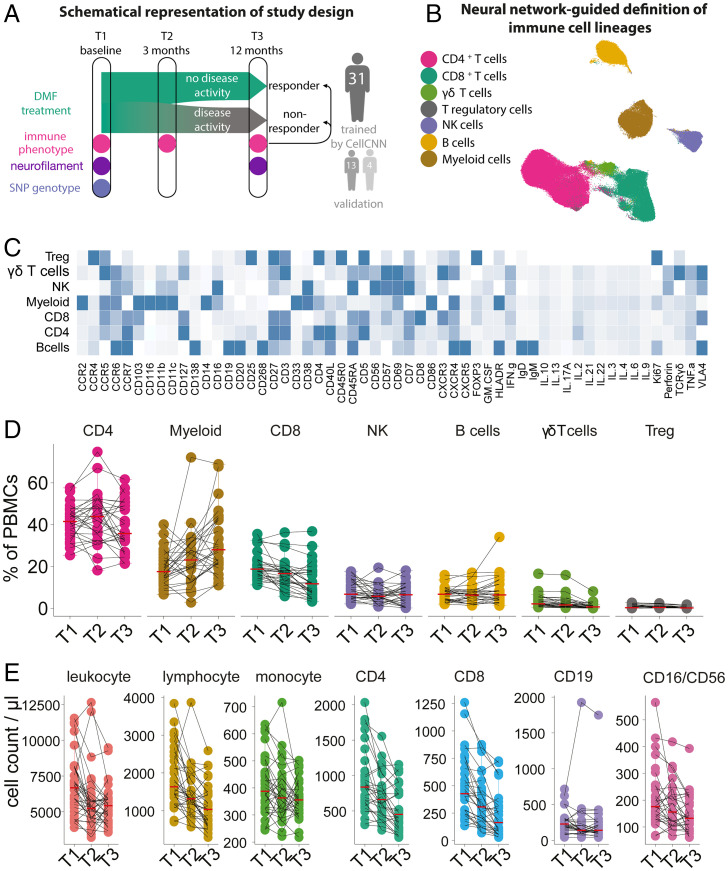
Fig. 1.
DMF treatment changes the peripheral immune profile of MS. (A) Blood samples and clinical data from a cohort of MS patients (n = 31, as well as two validation cohorts) before the initiation of DMF therapy and at 3- and 12-mo follow-up were longitudinally collected and analyzed for immune profile by mass cytometry and SNPs by DNA microarray. (B) UMAP representation of analyzed peripheral blood immune cells with overlaid color code as categorized by FlowSOM-defined clusters. (C) Immune compartments as defined by FlowSOM-defined clusters. Mean expression profile of all analyzed parameters in each defined population. (D) Longitudinal frequencies of the immune populations in blood in relative numbers. (E) Longitudinal cell counts of the main immune populations in blood in absolute numbers.

