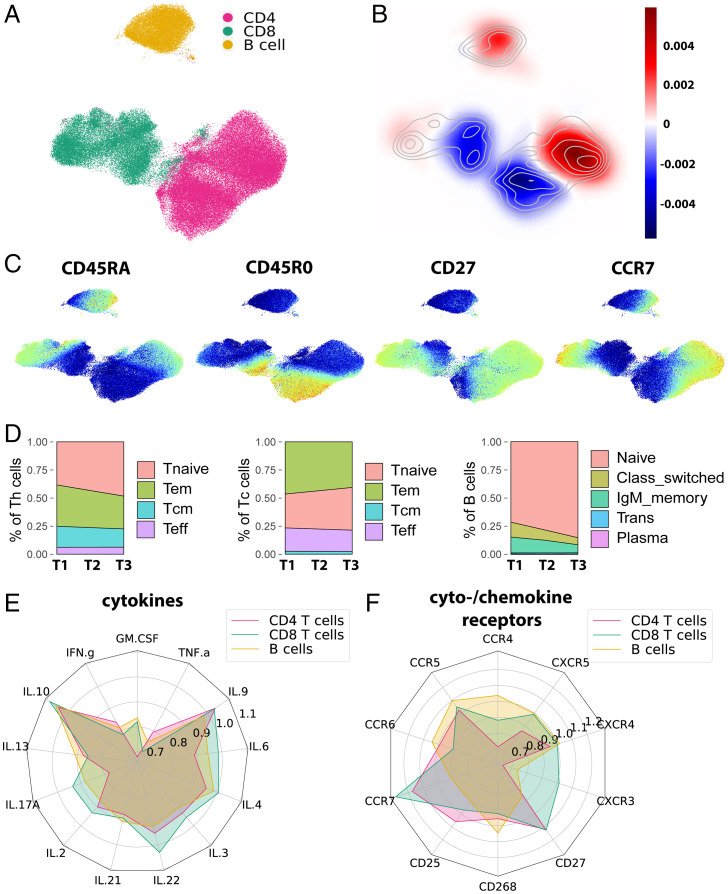
Fig. 2.
DMF treatment primarily affects mature T and B cells. (A) UMAP representation of B cell and Th and Tc cell subsets with overlaid color code as categorized by FlowSOM-defined clusters. (B) The change of density (blue indicating decrease and red indicating increase during follow-up) within the UMAP representation was computed via a Gaussian kernel density estimation for change between T1 and T3. (C) Expression maps of representative markers of lymphocyte maturation in the UMAP representation. (D) Frequencies of established maturation cell types of Th cells, Tc cells, and B cells at time points T1 to T3 visualized in area plots. (E) Radar chart depicting the change of mean cytokine expression (T3/T1) in each cell type for CD4 T cells, CD8 T cells, and B cells. (F) Radar chart depicting the change of mean cytokine and chemokine receptor expression (T3/T1) in each cell type for CD4 T cells, CD8 T cells, and B cells.

