Fig. 3.
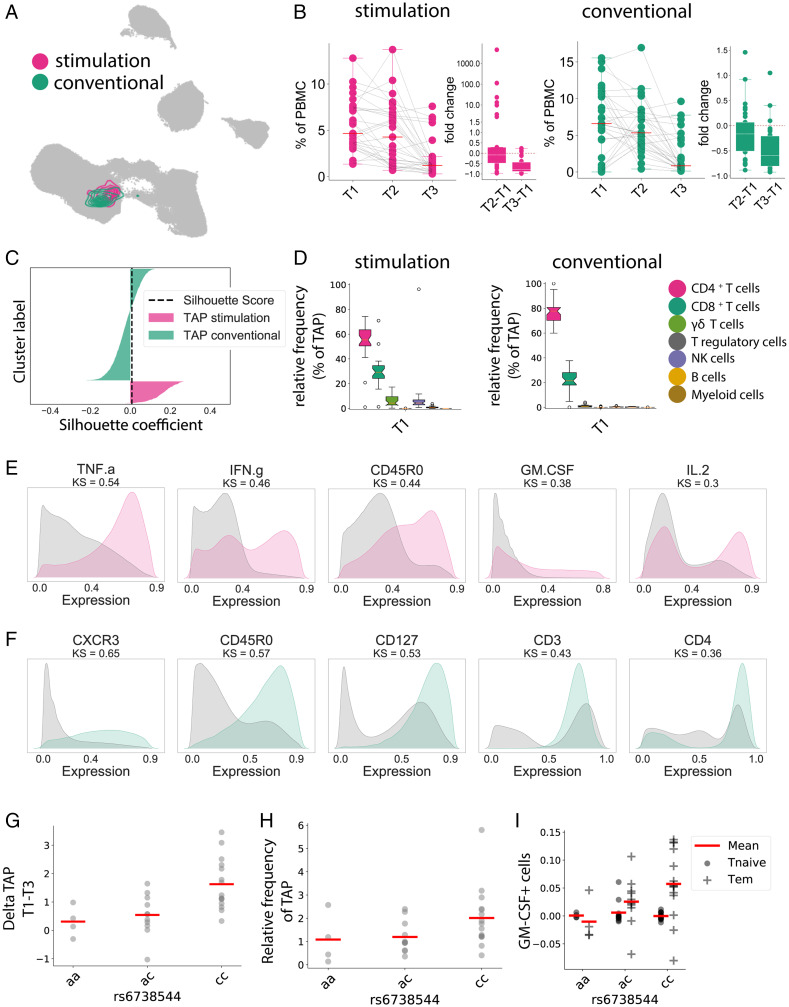
Automated multipanel analysis with CellCnn identifies an inflammatory Tem phenotype associated with DMF therapy. CellCnn analysis determined the core immune features between T1 and T3 from our patient cohort, termed the “treatment-associated phenotype” (TAP). (A) The UMAP algorithm was used to depict the identified cell filter in the conventional (green) and stimulated (red) panels. (B) Frequency of selected cells within the Th compartment at T1, T2, and T3, and the relative fold changes compared with baseline. (C) The overlap between both cell filters is estimated using silhouette analysis. The black dashed line represents the silhouette score. (D) Frequency of selected cell types within the treatment-associated phenotype at T1 in the stimulated panel and in the conventional panel. (E) Expression patterns of the five key discriminant markers between the treatment-associated phenotype and the reference cell population for the stimulated panel. Distance between patterns for each marker quantified by the Kolmogorov–Smirnov (KS) test. (F) Expression patterns of the five key discriminant markers between the treatment-associated phenotype and the reference cell population for the conventional panel. (G) Frequency change of the treatment-associated population between T1 and T3 in correlation with alleles of rs6738544. (H) Frequency of the treatment-associated population at T1 in correlation with alleles of rs6738544. (I) Frequency change of GM-CSF expression in Tem and Tn between T1 and T3 in correlation with alleles of rs6738544.

