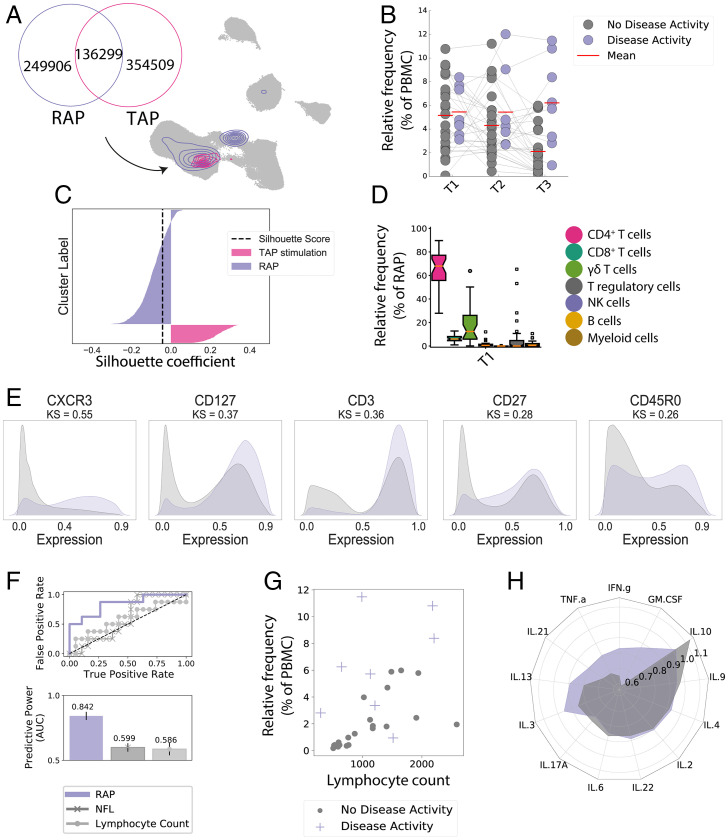
Fig. 4.
CXCR3 effector-memory T cell population correlates with DMF treatment response. Longitudinal CellCnn analysis determined the characterizing immune features of the therapy response from our patients’ cohort, as defined by relapses and/or new/active MRI lesions, termed the “response-associated phenotype” (RAP). (A) The UMAP algorithm was used to depict the identified response-associated (RAP, purple) and DMF treatment–associated cell filters (TAP, pink). (B) Frequency of the response-associated cell filter in patients with and without signs of disease activity, arranged for all three time points. (C) The silhouette analysis suggests the overlap of response-associated and DMF treatment–associated cell populations. The black dashed line represents the silhouette score. (D) Frequency of selected cell types within the response-associated phenotype at T1 in the stimulated panel. (E) Expression patterns of key discriminant markers between the response-associated population (purple) and the reference cell population (gray). (F) ROC curve depicting the accuracy of predicting disease activity at T3 for absolute lymphocyte counts at T3, NfL at T3, and response-associated population frequency at T3. Bars illustrate the predictive accuracy and SD at intragroup cross-validation. (G) Scatter plot of lymphocyte counts and frequency of the response-associated population at T3 with overlaid color code for disease activity. Each dot represents one patient. (H) Mean relative change between T1 and T3 of cytokine expression of analyzed cytokines in Tem. Each radius arm represents one cytokine and purple color indicates individuals with disease activity.

