. 2022 Feb 4;210(8):613–621. doi: 10.1097/NMD.0000000000001503
Copyright © 2022 Wolters Kluwer Health, Inc. All rights reserved.
This article is made available via the PMC Open Access Subset for unrestricted re-use and analyses in any form or by any means with acknowledgement of the original source. These permissions are granted for the duration of the COVID-19 pandemic or until permissions are revoked in writing. Upon expiration of these permissions, PMC is granted a perpetual license to make this article available via PMC and Europe PMC, consistent with existing copyright protections.
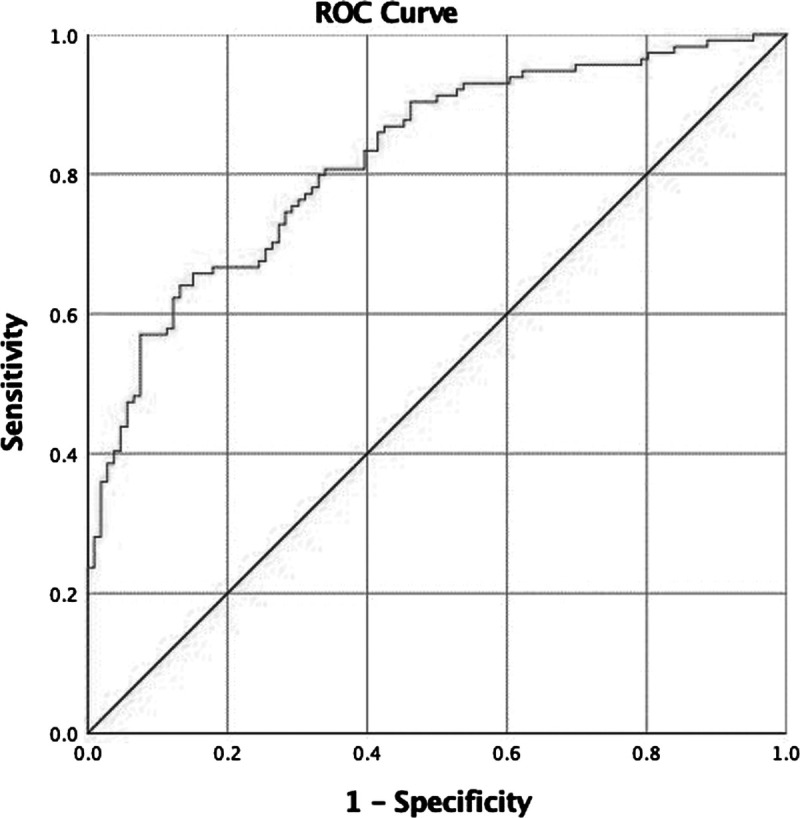
FIGURE 1.

ROC curve for the HRBs model.
