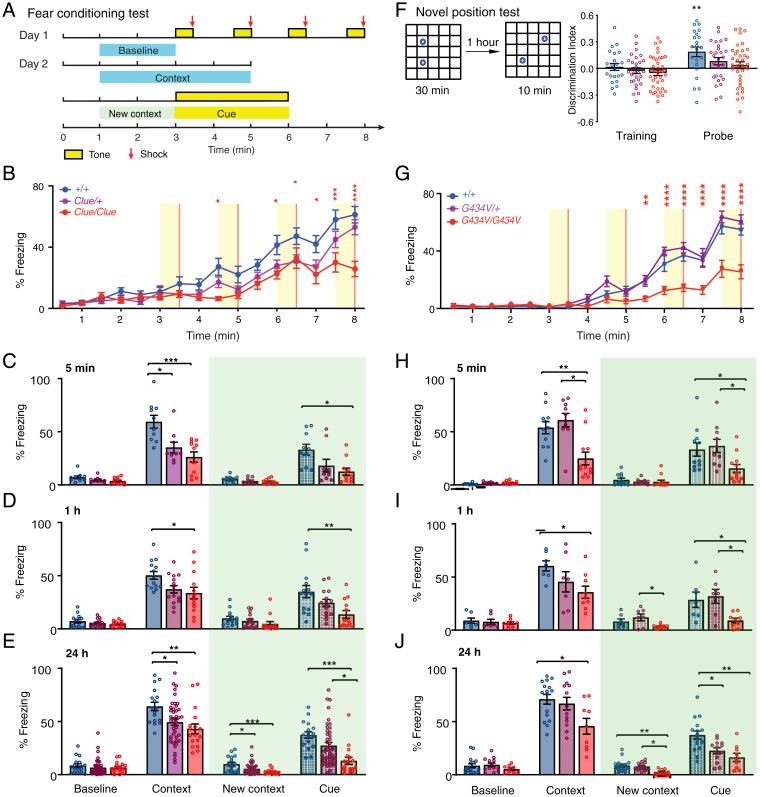
Fig. 2.
Spatial-learning deficits in Clueless (Clue) mice are specific and due to the G434V mutation. (A) Schematic of the fear-conditioning test. (B) Percent freezing time during training, +/+ (n = 18), Clue/+ (n = 20), Clue/Clue (n = 16). Data are reported as mean ± SEM. ****P < 0.0001, ***P < 0.001, **P < 0.01, *P < 0.05. Two-way repeated measures ANOVA results: genotype × time interaction, F30,765 = 3.305, ****P < 0.0001; time effect, F15,765 = 65.63, ****P < 0.0001; genotype effect, F2,51 = 6.769, **P = 0.0025, adjusted with Tukey’s post hoc test. (C) Percent freezing time tested 5 min after training: +/+, n = 10; Clue/+, n = 9; Clue/Clue, n = 11. ***P < 0.001, *P < 0.05. Results of one-way ANOVA adjusted with Tukey’s post hoc test: contextual % freezing, F2,27 = 10.66, P = 0.0004; cued % freezing, F2,27 = 5.086, P = 0.0133; baseline % freezing, F2,27 = 2.974, P = 0.0680; changed context baseline % freezing, F2,27 = 2.103, P = 0.1416. (D) Percent freezing time tested 1 h after training: +/+, n = 14; Clue/+, n = 15; Clue/Clue, n = 13. **P < 0.01, *P < 0.05, one-way ANOVA adjusted with Tukey’s post hoc test. Contextual % freezing, F2,39 = 4.313, P = 0.0203; cued % freezing, F2,39 = 5.81, P = 0.0062; baseline % freezing, F2,39 = 1.257, P = 0.2957; changed context baseline % freezing, F2,39 = 1.695, P = 0.1968. (E) Percent freezing time tested 24 h after training: +/+, n = 17; Clue/+, n = 43; Clue/Clue, n = 17. ***P < 0.001, **P < 0.01, *P < 0.05, one-way ANOVA adjusted with Tukey’s post hoc test. Contextual % freezing, F2,74 = 5.803, P = 0.0046; cued % freezing, F2,74 = 8.779, P = 0.0004; baseline % freezing, F2,74 = 0.5131, P = 0.6008; changed context baseline % freezing, F2,74 = 8.192, P = 0.0006. (F) Schematic for a novel position test. Mice were trained in the arena with two identical objects for 30 min. +/+, n = 22; Clue/+, n = 28; Clue/Clue, n = 36. One-sample t test, two tailed, +/+, P = 0.6617; Clue/+, P = 0.4473; Clue/Clue, P = 0.147. One hour later, one object was moved to a new location and the exploratory behavior to the objects was analyzed for 10 min. One-sample t test, two tailed, +/+, **P = 0.0025; Clue/+, P = 0.054; Clue/Clue, P = 0.3706. (G–J) Data from CRISPR-Cas9 engineered Kcnc3_mutant line L53; (G) percentage of freezing time during training. +/+, n = 14; Kcnc3G434V/+, n = 13; Kcnc3G434V/G434V, n = 14. Two-way repeated measures ANOVA results: genotype × time interaction, F30,570 = 7.901, ****P < 0.0001; time effect, F15,570 = 120.3, ****P < 0.0001; genotype effect, F2,38 = 27.01, ****P < 0.0001, adjusted with Tukey’s post hoc test. (H) Percentage of freezing time 5 min after training; +/+, n = 11; Kcnc3G434V/+, n = 10; Kcnc3G434V/G434V, n = 12. ***P < 0.0001, * P < 0.05. Results of one-way ANOVA, adjusted with Tukey’s post hoc test: contextual % freezing, F2,30 = 10.44, ***P = 0.0004; cued % freezing, F2,30 = 5.078, *P = 0.0126; baseline % freezing, F2,30 = 3.14, P = 0.0578; changed context baseline % freezing, F2,30 = 0.5018, P = 0.6104. (I) Percent freezing time tested 1 h after training; +/+, n = 7; Kcnc3G434V/+, n = 7; Kcnc3G434V/G434V, n = 9. *P < 0.05. Results of one-way ANOVA, adjusted with Tukey’s post hoc test: contextual % freezing, F2,20 = 3.547, *P = 0.0480; cued % freezing, F2,20 = 5.522, *P = 0.0123; baseline % freezing, F2,20 = 0.3523, P = 0.7073; changed context baseline % freezing, F2,20 = 4.009, *P = 0.0343. (J) Percent freezing time tested 24 h after training; +/+, n = 16; Kcnc3G434V/+, n = 13; Kcnc3G434V/G434V, n = 9. *P < 0.05. Results of one-way ANOVA, adjusted with Tukey’s post hoc test: contextual % freezing, F2,35 = 4.816, *P = 0.0142; cued % freezing, F2,35 = 8.823, ***P = 0.0008; baseline % freezing, F2,35 = 1.085, P = 0.3491; changed context baseline % freezing, F2,35 = 5.318, **P = 0.0096. Data are reported as mean ± SEM.

