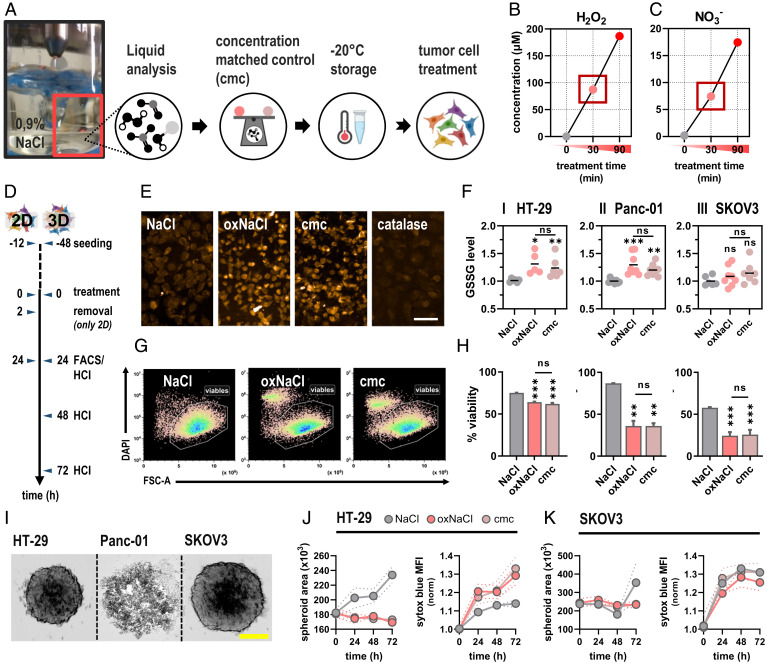
Fig. 1.
Gas plasma treatment of sodium chloride (oxNaCl) deposits mainly H2O2 and NO3−, which was mimicked in a cmc to elicit lethal oxidative stress in tumor cells. (A) Schematic overview of liquid preparation and storage for subsequent experiments. (B and C) Quantification of H2O2 (B) and NO3− (C). (D) Schematic overview of experimental treatment procedures in 2D and 3D cell culture models. (E) Representative fluorescence microscopy images of oxidized glutathione (GSSG) in cells exposed to either oxNaCl or cmc. (Scale bar, 20 µm.) (F) GSSG quantification. (G) Representative flow cytometry dot plots of cells. (H) Quantification of viable HT-29 (I), Panc-01 (II), and SKOV3 (III). (I) Representative brightfield images of HT-29, Panc-01, and SKOV3 tumor spheroids. (Scale bar, 200 µm.) (J and K) Kinetic evaluation of spheroid growth in HT-29 (J) and SKOV3 (K) tumor spheroids and nucleic acid–staining sytox blue. Graphs show mean ± SEM (SEM). Statistical analysis was performed using ANOVA. (*P < 0.05, **P < 0.01, ***P < 0.001; ns, nonsignificant). FACS, fluorescence activated cell sorting; HCI, high content imaging; DAPI, 4',6-Diamidino-2-phenylindol; MFI, mean fluorescence intensity.

