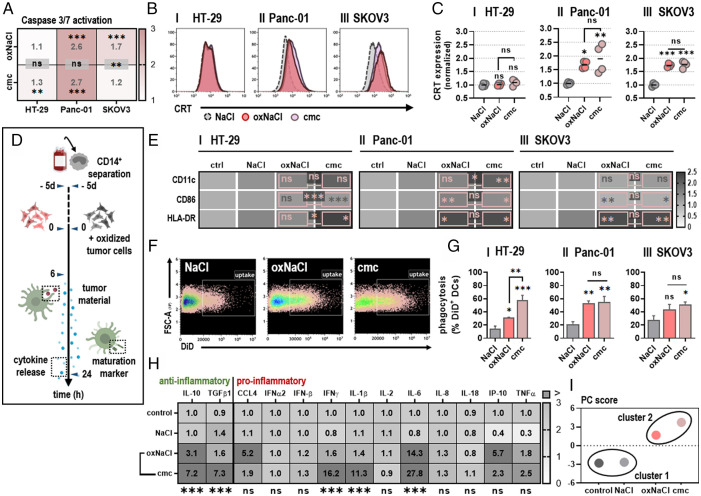
Fig. 2.
oxNaCl and cmc equally promote tumor cell uptake by DCs and an enhanced inflammatory profile. (A) Quantification of apoptotic HT-29 (I), Panc-01 (II), and SKOV3 (III) cells normalized to NaCl. (B) Representative flow cytometry intensity histograms of CRT surface expression of viable cells. (C) CRT MFI quantification and normalization for HT-29 (I), Panc-01 (II), and SKOV3 (III) cells. (D) Schematic overview of experimental treatment procedure for coculture experiments. (E) Quantification of DC maturation markers cocultured with tumor cells cultured in medium (control [ctrl]), NaCl, oxNaCl, or cmc and normalized to controls. (F) Representative flow cytometry dot plots of CD11c+/DiD+ DCs. (G) Quantification of phagocytosis of HT-29 (I), Panc-01 (II), SKOV3 (III) tumor cells previously exposed to liquids as labeled. (H) Chemokine and cytokine profiles in supernatants of DCs cocultured with tumor cells cultured in medium (control), NaCl, oxNaCl, or cmc and normalized to controls. (I) Principal component (PC) score calculated from maturation marker and cytokine release profiles of DCs cocultured with tumor cells cultured in medium (control), NaCl, oxNaCl, and cmc. Bar graphs show mean + (SEM). Heat maps show median. Statistical analysis was performed using one-way ANOVA. (*P < 0.05, **P < 0.01, ***P < 0.001; ns, nonsignificant). MFI, mean fluorescence intensity.

