Fig. 3.
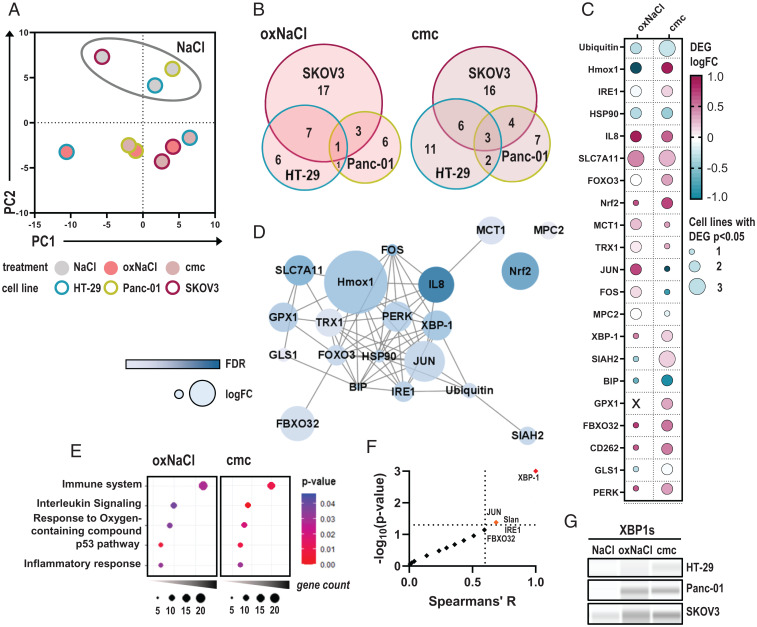
oxNaCl and cmc induce comparable changes in gene expression profiling. (A) PCA of z-scored gene expression patterns in HT-29, Panc-01, and SKOV3 tumor cells 4 h after exposure to respective solutions. (B) Venn diagrams. (C) Median log fold-changes (logFCs) of 21 differentially expressed genes (DEGs) in at least two cell lines and one treatment regimen (oxNaCl or cmc). (D) String interaction network of corresponding proteins. (E) Pathway enrichment dot plots of gene ontology (GO) terms after exposure to oxNaCl (Left) and cmc solutions (Right). (F) Spearman correlation of % viability reduction against log fold-changes (logFC) of DEGs. (G) Representative Western blot images of XBP-1s expression in HT-29, Panc-01, and SKOV3 cell lines 6 h after exposure to NaCl, oxNaCl, or cmc. FDR, false discovery rate.

