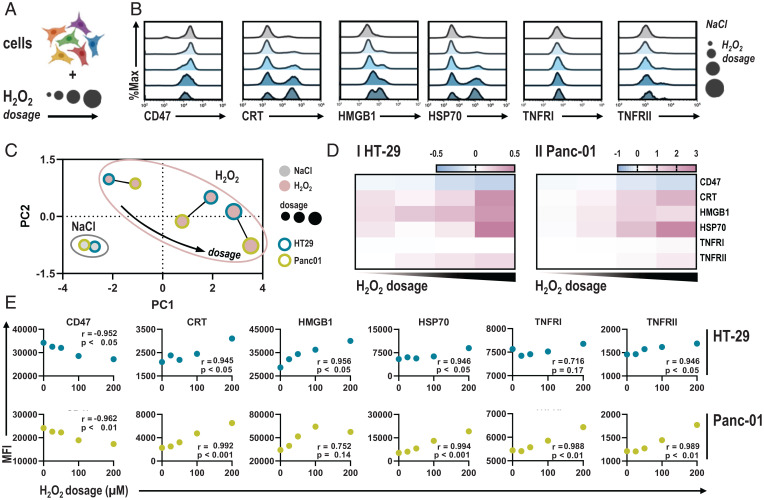
Fig. 5.
H2O2 dosage correlates with immune-related and immunogenic surface marker expression profiles. (A) Schematic overview of experimental procedure. (B) Representative flow cytometry intensity histograms of CD47, CRT, HMGB1, HSP 70, and TNFR I and II. (C) PCA of z-scored marker expression profiles in HT-29 and Panc-01 cells. (D) Quantification of marker expression normalized to NaCl in HT-29 and Panc-01 cells. (E) Pearson correlation of marker MFI and H2O2 dosage. Heat map shows median. Graphs show mean. MFI, mean fluorescence intensity.

