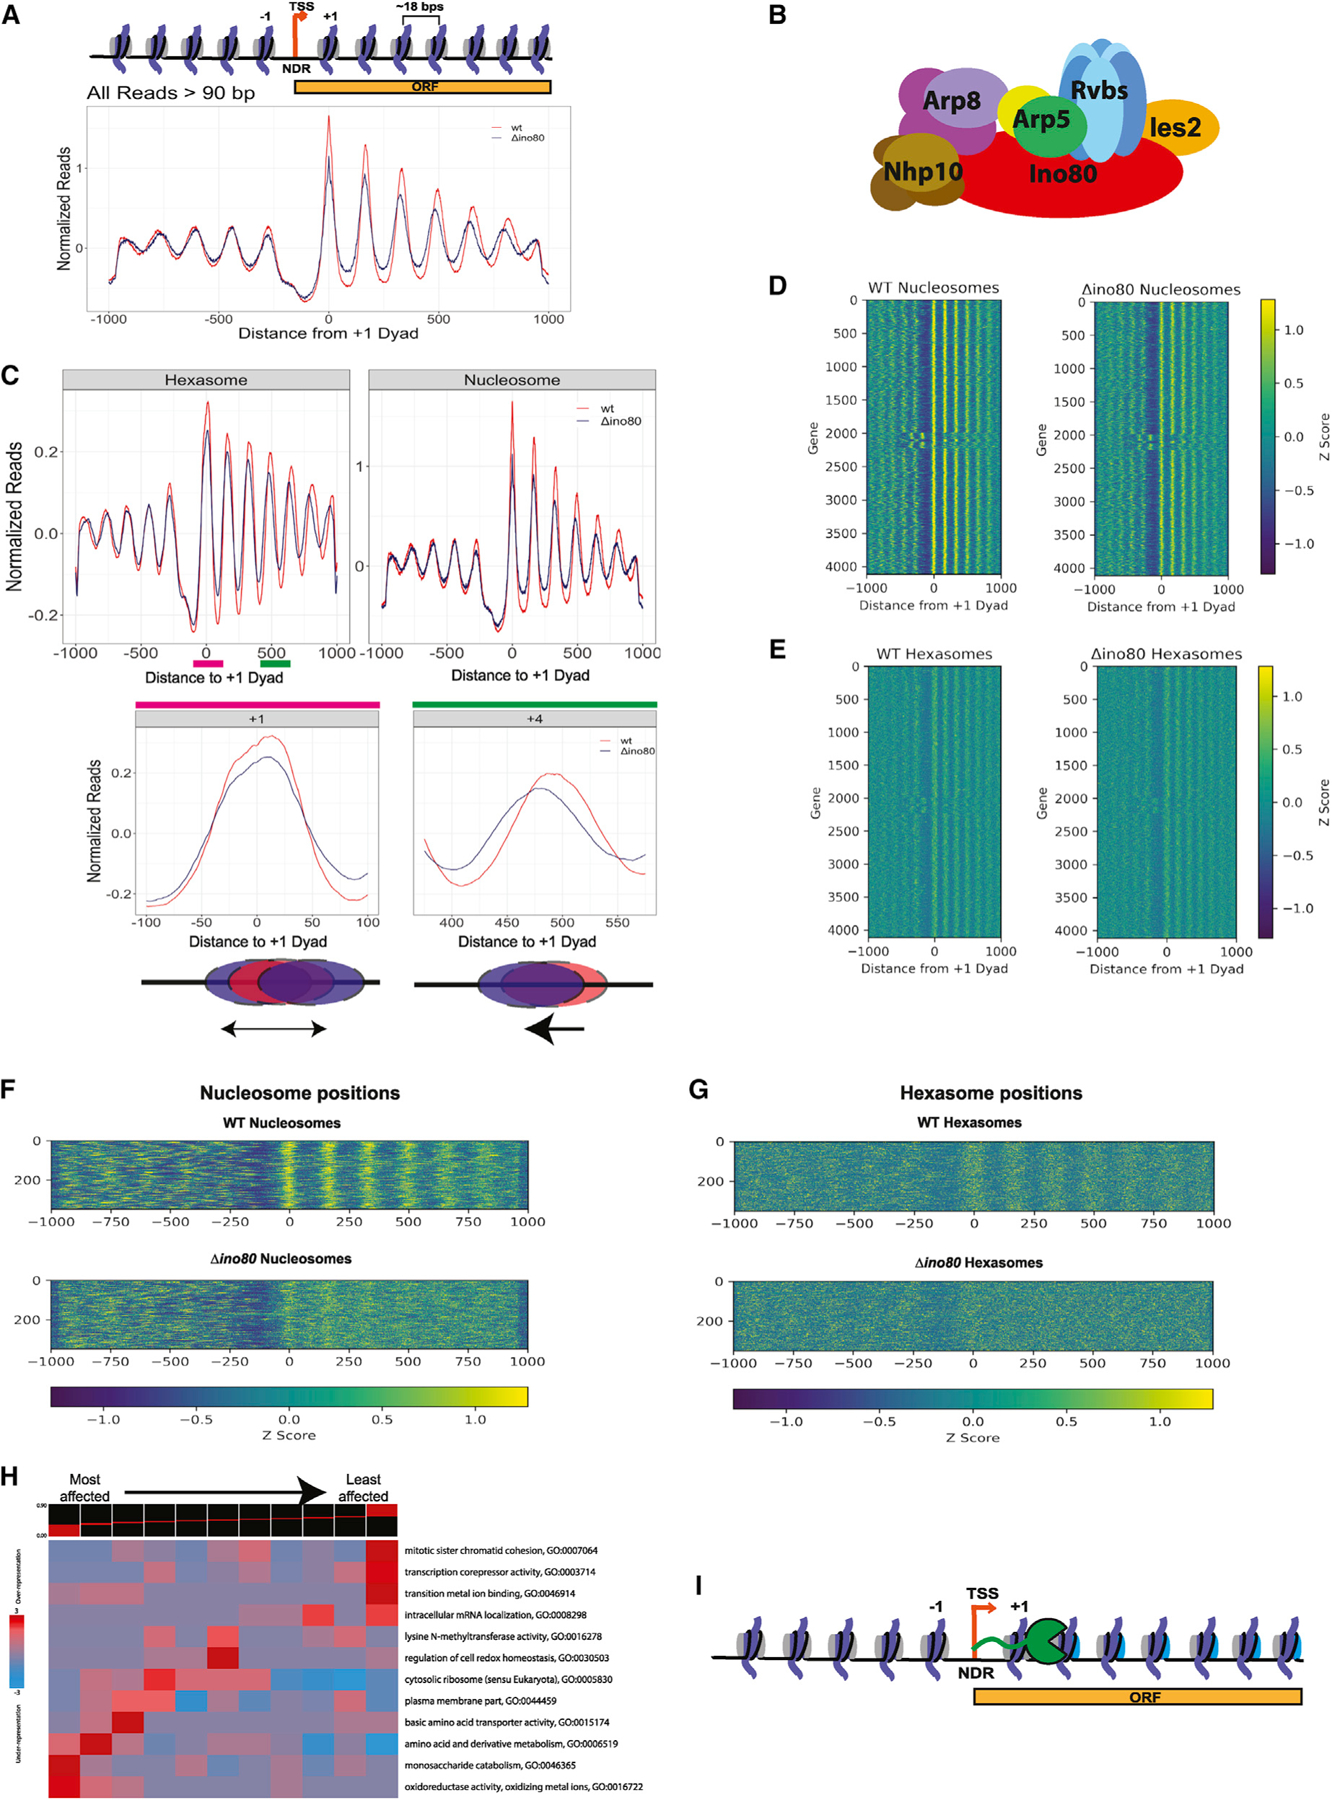
Figure 1. INO80 regulates positions of subnucleosomal particles in vivo.

(A and B) (A) Normalized MNase signal at the TSSs of all genes for WT, in orange, and Δino80, in dark blue, for all fragment lengths greater than 90 bps. The x axis represents distance from +1 nucleosome dyad. Upper panel: schematic of the corresponding chromatin architecture in (B) illustration of the INO80 complex. Only one subunit per module is labeled.
(C) Upon deletion of Ino80, nucleosomes and hexasomes are less well positioned at +1 location and display shifted positions in gene body. Upper panel: fragments were binned by sizes representing either hexasomes (100 ± 10 bps) or nucleosomes (147 ± 10 bps), and the average signal at TSSs and in the gene body are plotted for WT and Δino80. Lower panel: pink and green lines in the hexasome plot from the upper panel are magnified to show hexasome footprints at +1 and +4 positions. Below the graphs are illustrations of the respective changes in positioning that occur from WT (red) to Δino80 (blue).
(D) Heatmap of nucleosome footprint signals across all genes for WT and Δino80 cells.
(E) Same as (D) but for the hexasome footprint signals.
(F) Data for genes where nucleosome positions are most affected by deletion of Ino80. A heatmap representing genes that had the lowest Spearman Rho correlation (i.e., most affected by deletion of Ino80) for nucleosome footprint signals ranging from the −100 to +1,000 bps of the +1 dyad between WT and Δino80.
(G) Data for the genes in (F) but focusing on hexasome positions.
(H) An iPAGE heatmap of the correlations of the nucleosome footprint signal between WT and Δino80 and their annotated GO terms. The genes have been binned into 11 groups, with the lowest correlation group (most affected in terms of nucleosome footprints) on the left, and the highest correlation group (least affected in terms of nucleosome footprints) on the right.
(I) Illustration of RNA Pol II traversing through the gene body. The promoter distal dimer that is lost during elongation is depicted in cyan.
