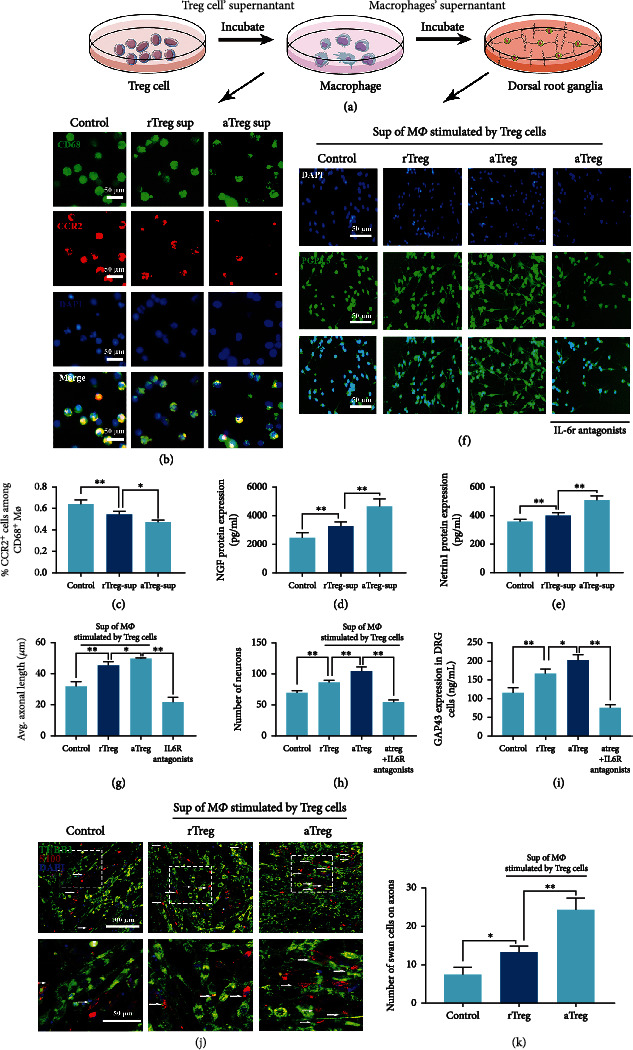
Figure 3.

Activated Treg cells promoted nerve regeneration by regulating CCR2+ macrophages. (a) Cartoon photo of experiment process in cell supernatants obtaining and function evaluating of nerve regeneration. (b) Rat macrophages incubated in Treg cell supernatants were visualized by immunofluorescence staining. rTreg sup: supernatant of regular Treg cells; aTreg sup: supernatant of Treg cells activated by H4000-CD25/dCas9 nanodelivery system. Green: CD68; red: CCR2; blue: DAPI. (c) Percentage of CCR2+ macrophages among CD68 macrophages. n = 6, one-way ANOVA followed by Tukey test. (d, e) The level of nerve growth-related factors (NGF) and Netrin-1 secreted by macrophages stimulated by the Treg cell supernatant for 2 days. N = 6, one- way ANOVA followed by Tukey test. (f) Immunofluorescence staining: the rat dorsal root ganglion incubated with supernatant of macrophages separately stimulated by rTreg and aTreg cells and a group of macrophage supernatant added with IL-6 antagonist. Blue: DAPI and green: PGP9.5. (g, h) Axon length and cell survival of DRG after coculturing with macrophage supernatants from each group, n = 6, one-way ANOVA followed by Tukey test. (i) GAP43 expression in DRG cells after coculturing with macrophage supernatant from each group. n = 6, one- way ANOVA followed by Tukey test. (j) Schwann cells and DRG cells were cocultured and then incubated with the supernatants of macrophages stimulated by rTreg and aTreg cells. (k) Number of Schwann cells grown on axons of DRG cells in each visual field, n = 12, one- way ANOVA followed by Tukey test. ∗P < 0.05, ∗∗P < 0.01, n.s.: no significance. Data are presented as means ± SD.
