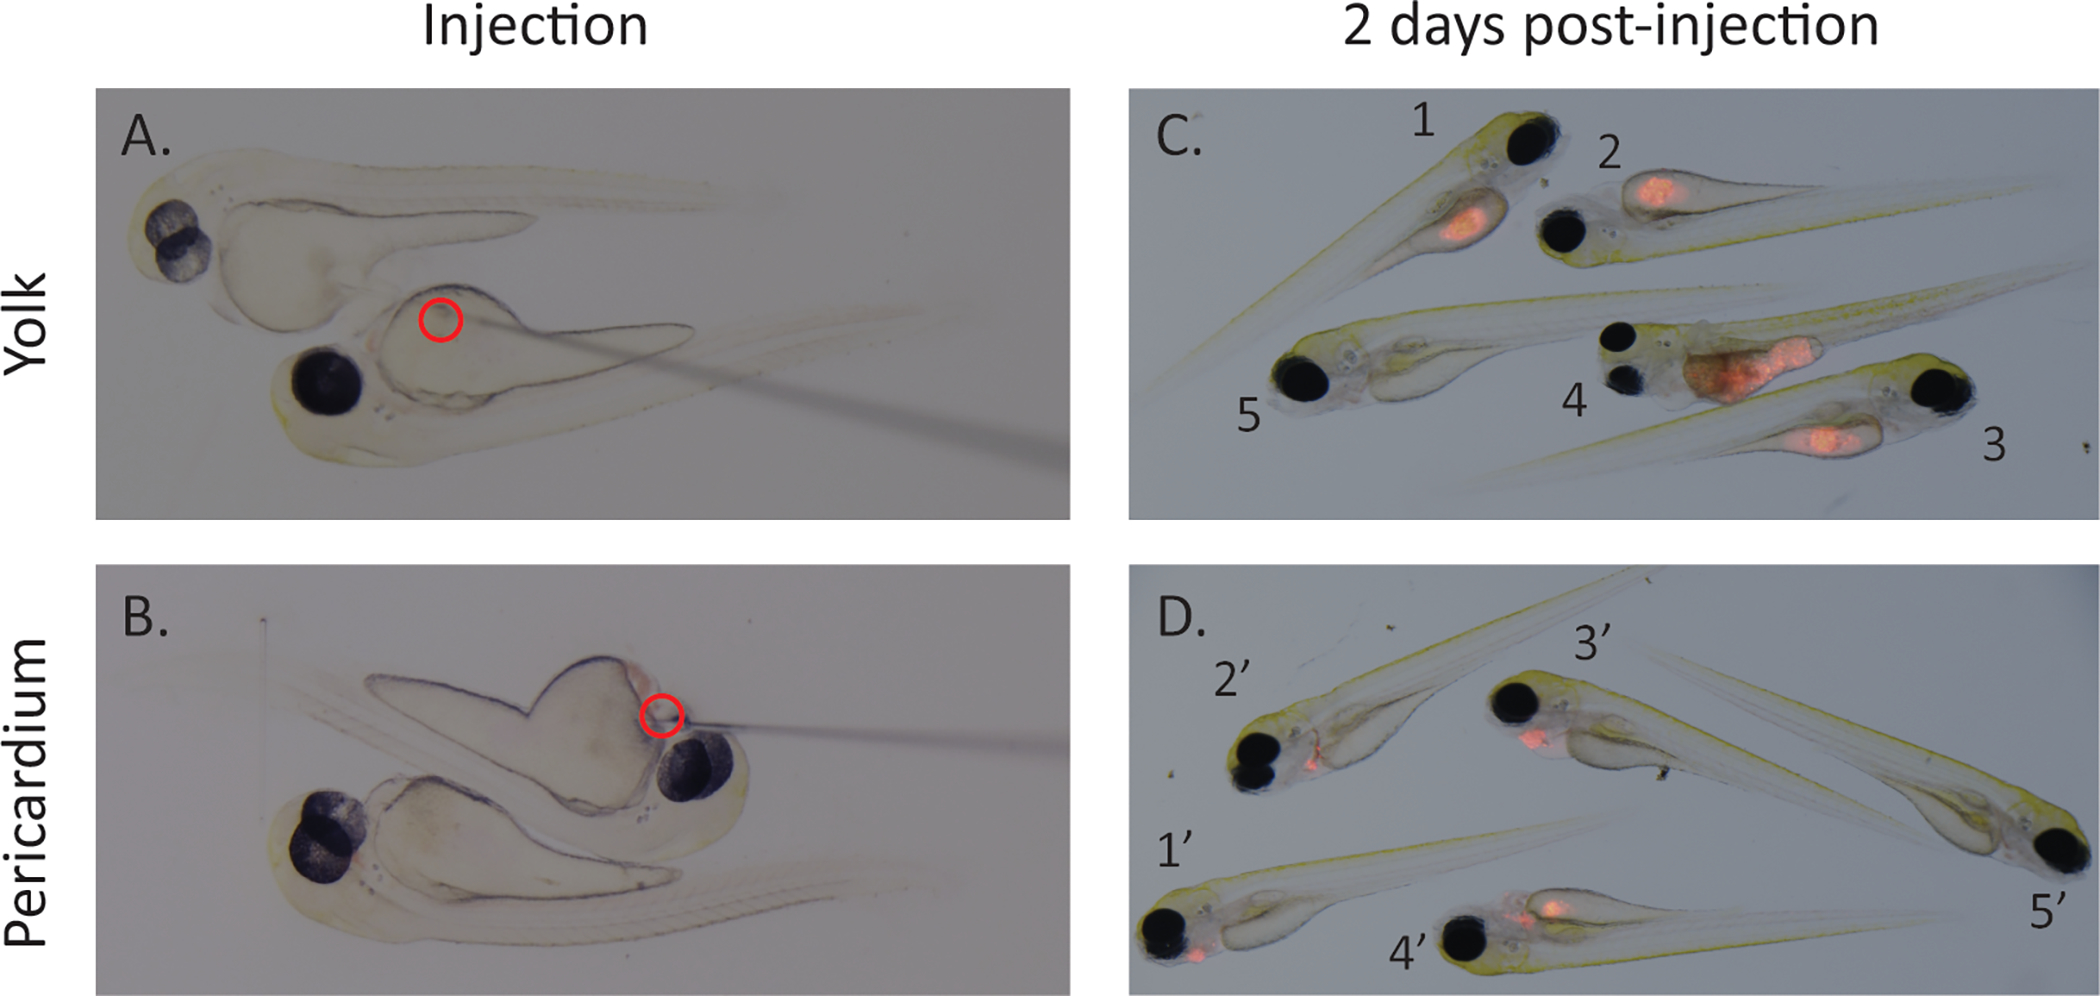
Figure 2: Injection site and representative images of screening xenografted fish.

Images of microinjector needle at time of injection into either the yolk (A) or pericardium (B) of 2 dpf zebrafish larvae. Representative images of screening at 2 dpi depict selection of zebrafish for drug screen (C,D). Zebrafish with similar engraftment (1–3 and 1’–3’) should be selected, unengrafted zebrafish (5 and 5’) should be removed. For yolk injected fish, remove fish where borders of the yolk cannot be seen around engrafted cell mass (4) as it makes quantification difficult. For pericardium injected fish, remove fish where injected cell mass encroaches into yolk sac (4’). Scale bar = 0.5 mm.
