Figure 1.

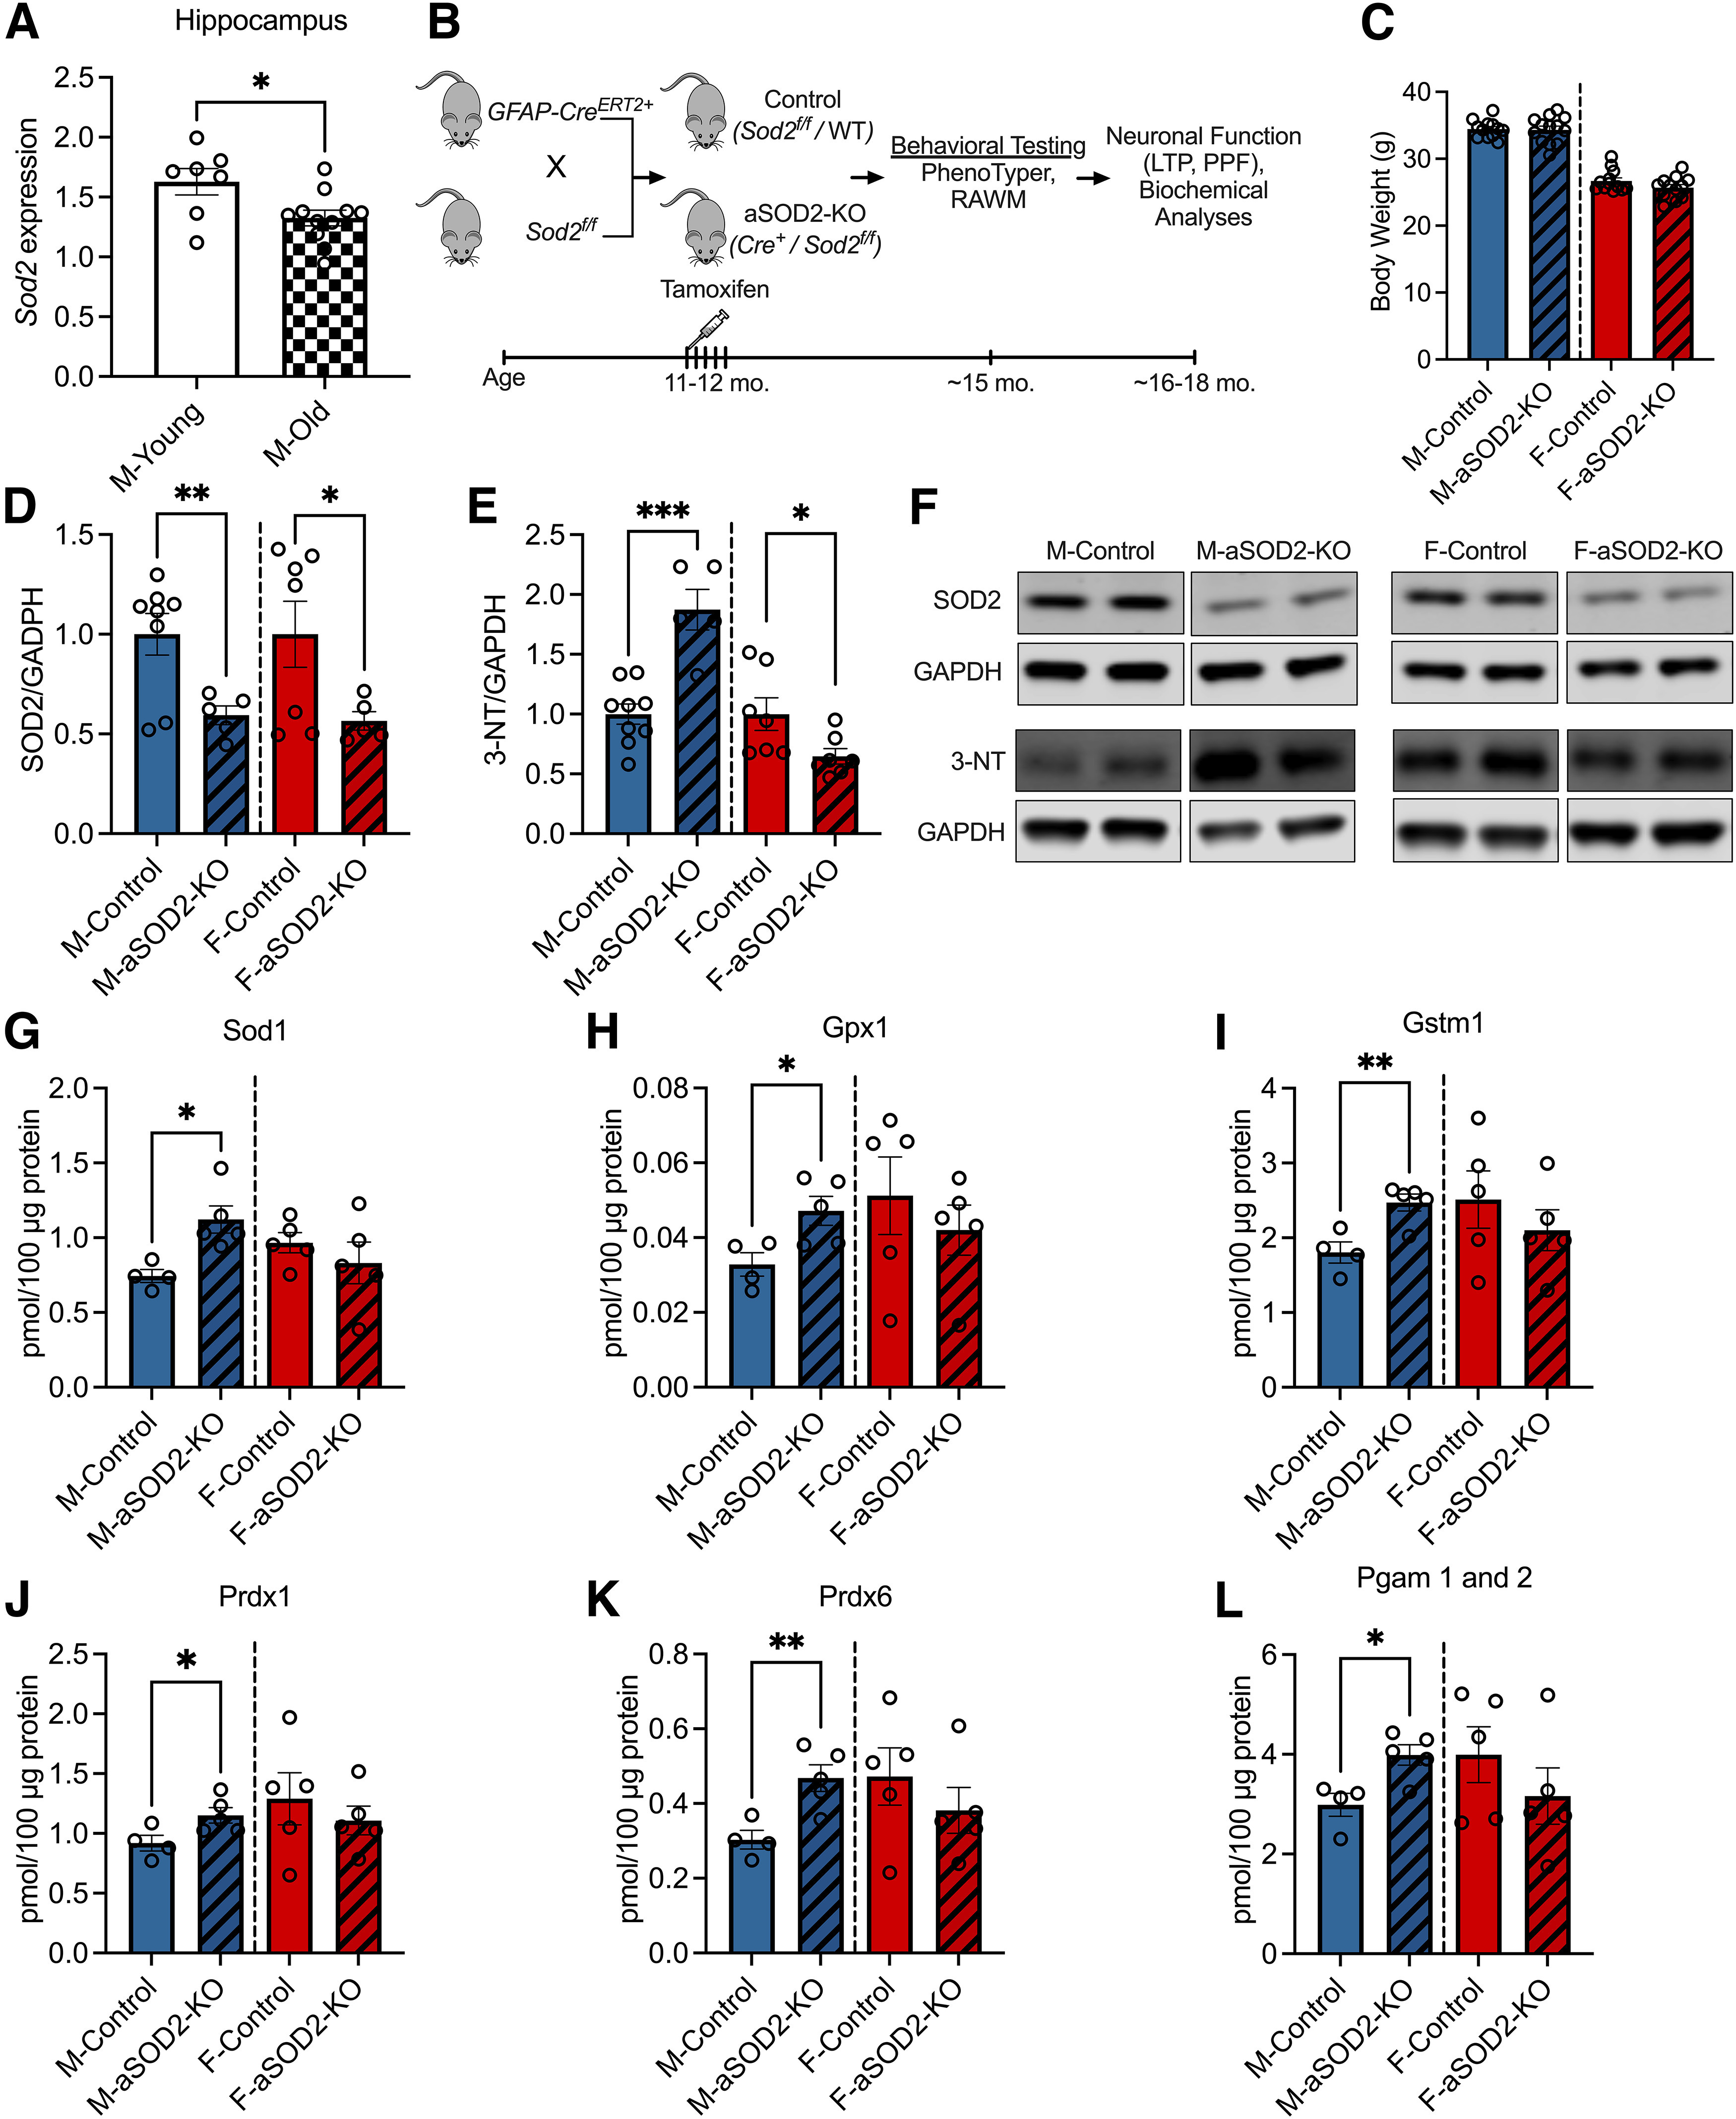
Effect of astrocyte-specific knockout of SOD2 on antioxidant response in male and female mice. A, Bar plots depicting decreased Sod2 mRNA expression in the hippocampus of aged (22 months of age; n = 11; shaded bar) male mice compared with young (6 months of age; n = 7; white bar) C57 controls (p = 0.02, two-tailed t test). B, Experimental schematic displaying the timeline of tamoxifen-induced aSOD2-KO in mice and subsequent behavioral testing, neuronal functional studies, and biochemical analyses. C, Bar plots depicting the weight of animals in our experimental cohort at the time of behavioral testing. There was no difference detected between the weights of aSOD2-KO animals compared with controls in male or female animals. D, Representative blot depicting reduced expression of SOD2 in the hippocampus of aSOD2-KO in male (n = 5; p = 0.006) and female (n = 5; p = 0.029) mice compared with aged-matched male (n = 8) and female (n = 7) controls, respectively (one-tailed t test). F, Blot was normalized to GAPDH. E, Western blot quantification of the oxidative stress marker 3-NT is significantly increased in aSOD2-KO males (n = 9/control, n = 5/KO; p = 0.001) and decreased in aSOD2-KO females (n = 6/controls, n = 7/KO; p = 0.018) compared with age-matched controls. F, Blot was normalized to GAPDH. G–L, Bar plots depicting quantification of mitochondrial antioxidant proteins Sod1 (p = 0.011), Gpx1 (p = 0.027), Gstm1 (p = 0.007), Prdx1 (p = 0.042), Prdx6 (p = 0.0087), and Pgam 1 and 2 (p = 0.014) in aSOD2-KO mice via targeted proteomic mass spectrometry analysis (n = 4–5 animals/group). For graphs in C–J, colored bars represent the following: males (blue), females (red), and aSOD2-KO (shaded). Error bars depict the mean ± SEM. Significance was tested using unpaired Student's t test (*p < 0.05, **p < 0.01, ***p < 0.001). Please see Extended Data Tables 1-1, 1-2, and 1-3.
