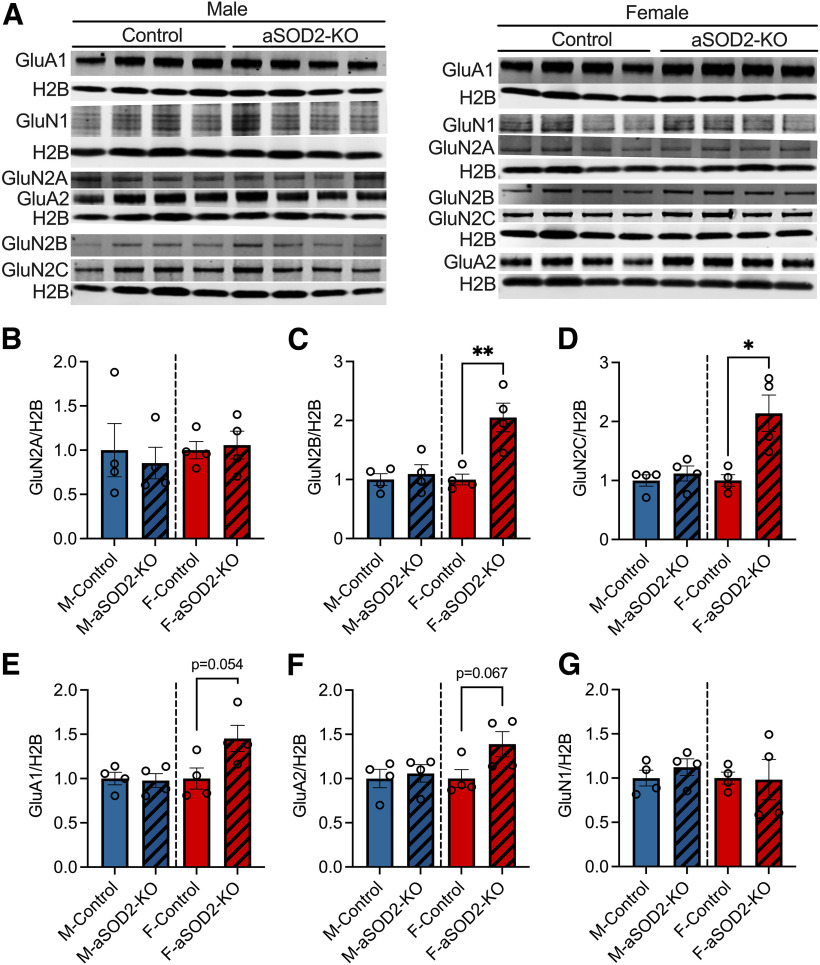
Figure 4.
AMPA receptor and NMDA receptor expression in aSOD2-KO brain tissue of both males and females. A, Blots representing the expression of AMPA (GluA1 and GluA2) and NMDA (GluN1, GluN2A, GluN2B, and GluN2C) receptor subunits in brain homogenates of male and female aSOD2-KO mice compared with controls (n = 4/group). Blots were normalized to H2B. B–G, Bar plots depicting quantification of GluN2A (B), GluN2B (C; p = 0.006), GluN2C (D; p = 0.012), GluA1 (E; p = 0.054), GluA2 (F; p = 0.067), and GluN1 (G) for male and female aSOD2-KO mice compared with controls. Blots were normalized to H2B. Colored bars represent the following: males, blue; females, red; aSOD2-KO, shaded. Error bars depict the mean ± SEM. Significance was tested using unpaired Student's t test (*p < 0.05; **p < 0.01).

