
Figure 6.
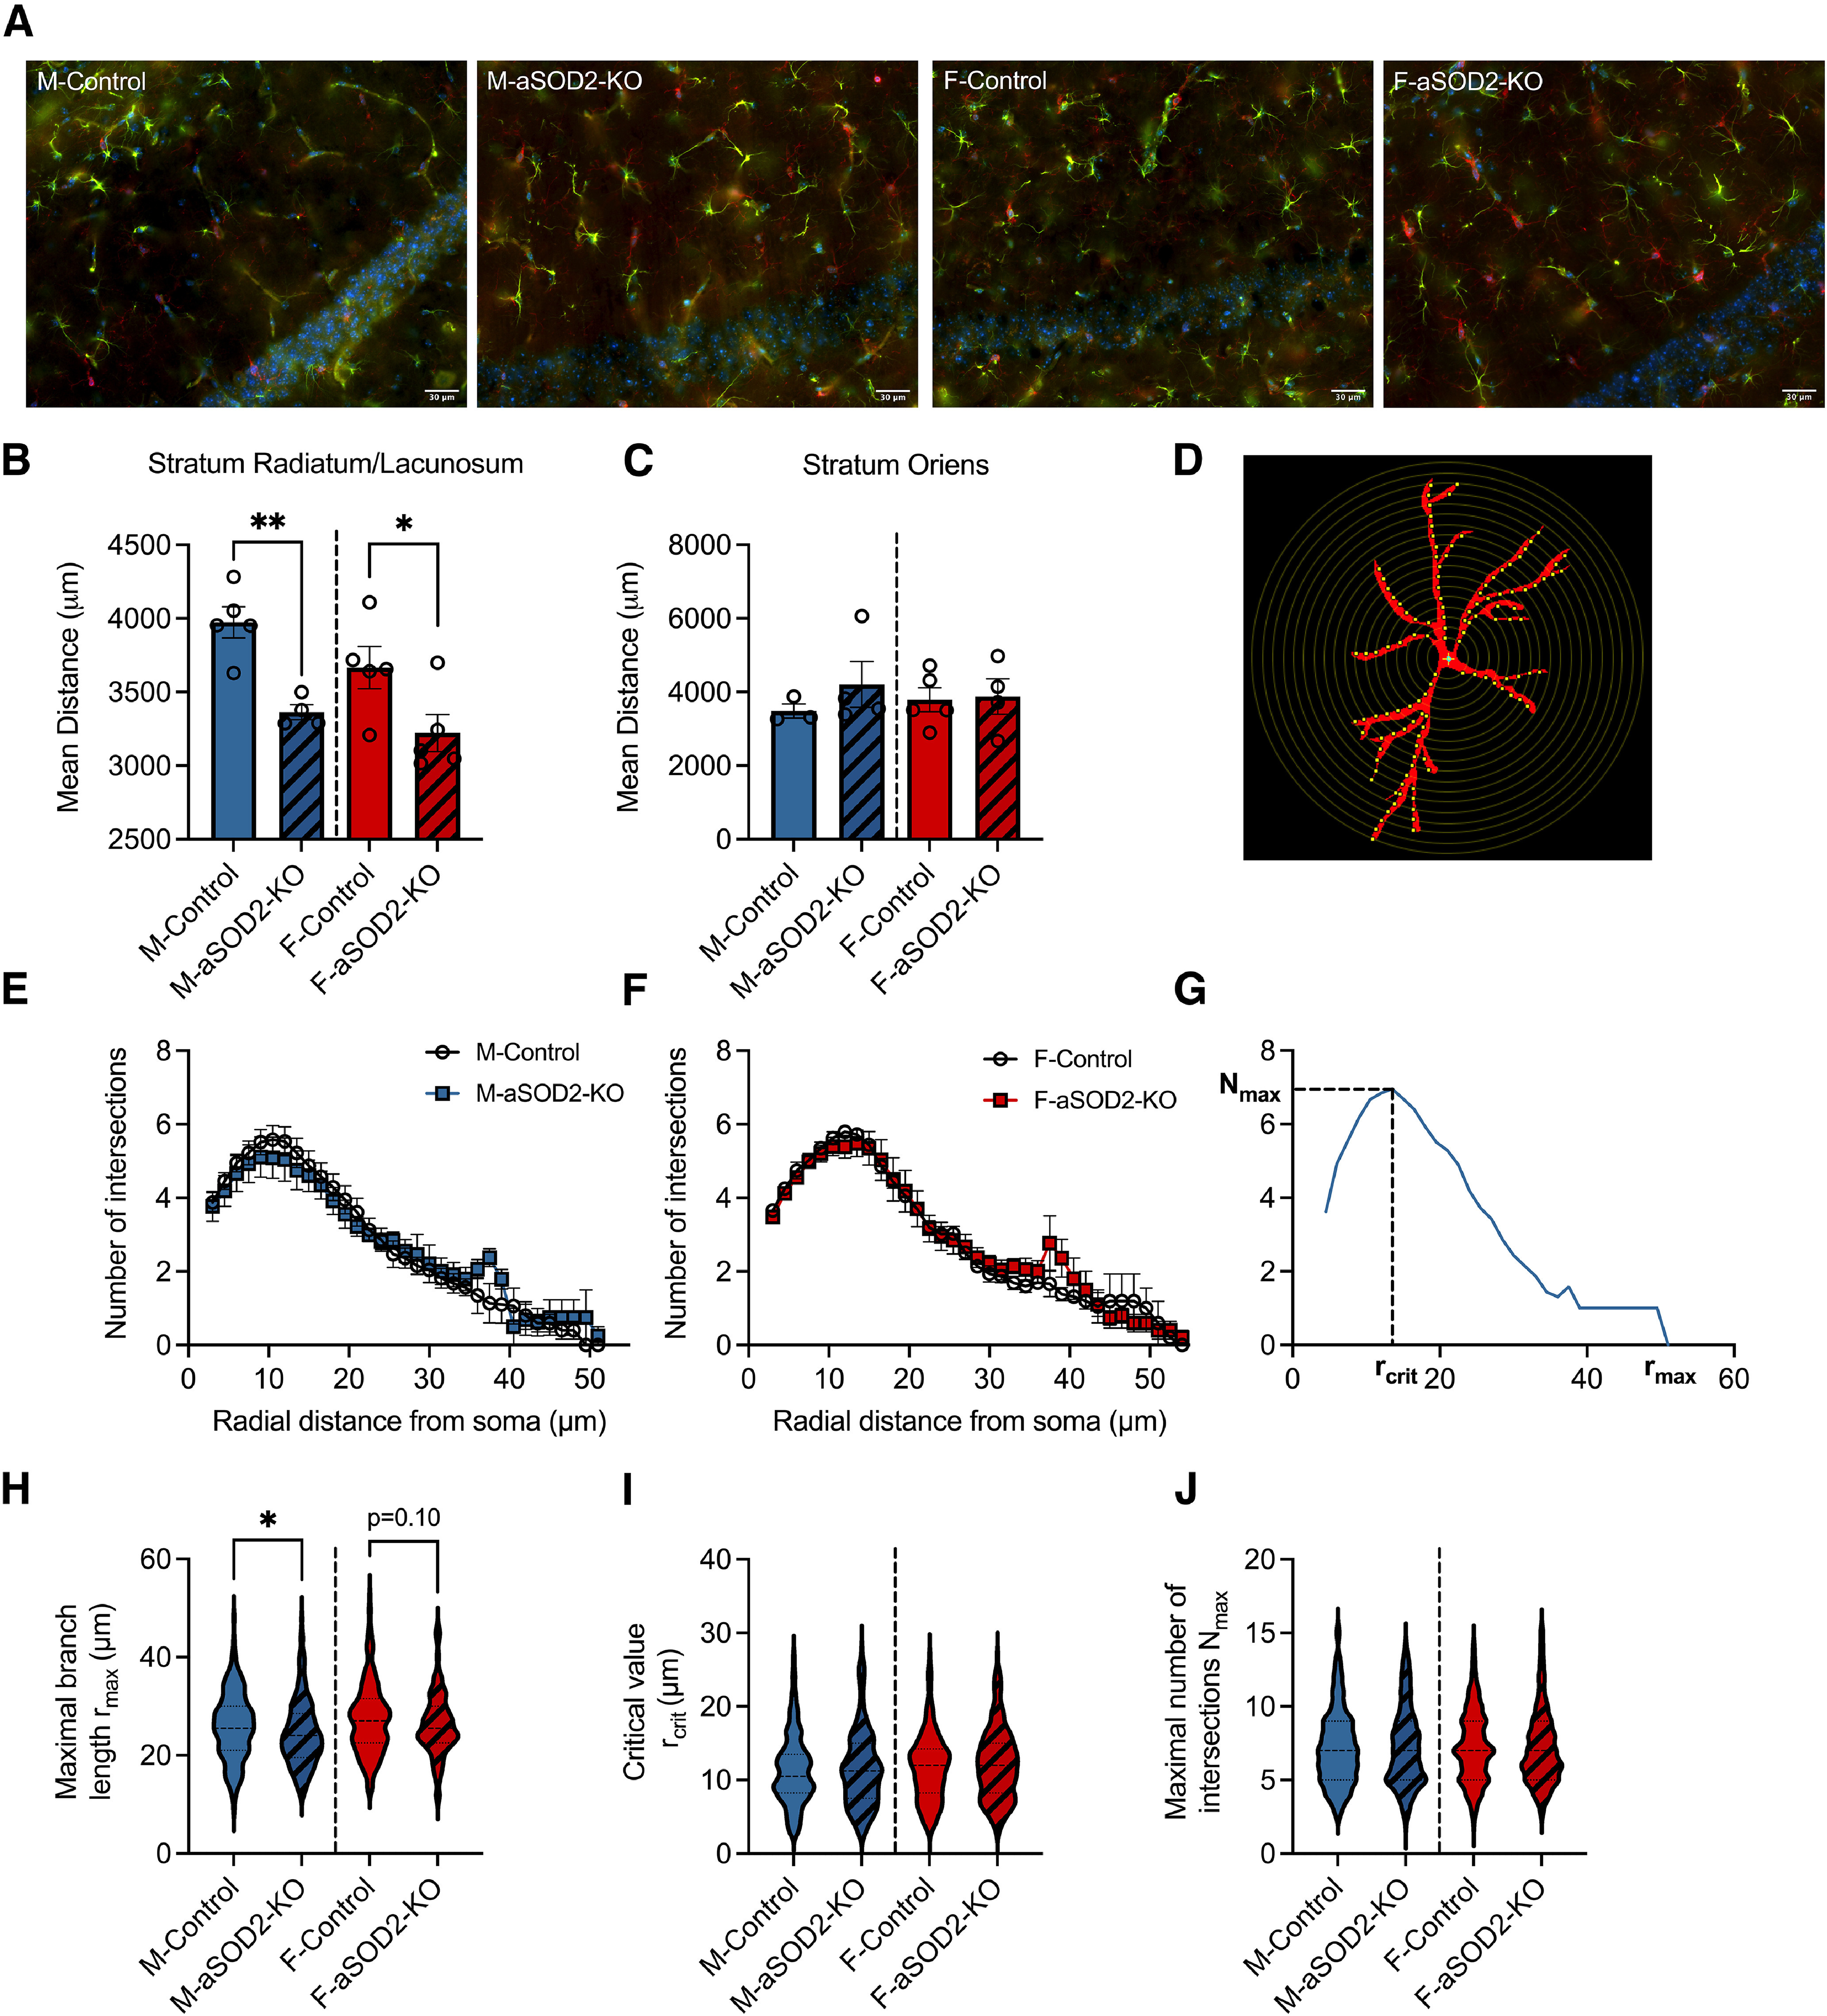
Astrocyte-specific SOD2-KO increases gliosis in the hippocampus of aSOD2-KO mice. A, Representative image montages of merged immunostained images labeled for GFAP (green; astrocytes), Iba1 (red; microglia), and DAPI (blue; nuclei) within the CA1 region of the hippocampus of male and female control and aSOD2-KO mice. Scale bar, 30 µm. B, Knockout of SOD2 in astrocytes produced a decrease in astrocyte spacing in stratum radiatum and stratum lacunosum (n = 4-5/group; p = 0.002 and p = 0.047) compared with control mice. C, No differences were detected in the mean distance between neighboring astrocytes in stratum oriens. D, Example of a GFAP-labeled astrocyte with superimposed concentric circles (step size, 1.5 µm) used for Sholl analysis. E, F, Quantification of the number of projection intersections plotted against radial distance from the soma shows no difference between aSOD2-KO and controls in males (E; N = 45 astrocytes/n, n = 4–5/group) and females (F; N = 45 astrocytes/n, n = 5/group). Clear circles represent controls, while colored squares represent aSOD2-KO for each sex, respectively. G, Representative Sholl plot of one astrocyte displaying the parameters of rmax, rcrit, and Nmax quantified in H–J. H, The rmax of astrocytic projections was decreased in aSOD2-KO males (N = 180–225 astrocytes, n = 4–5/group; p = 0.031) compared with controls while aSOD2-KO females had a trending decrease (N = 225 astrocytes, n = 5/group; p = 0.10) compared with controls. I, J, No changes were detected in the rcrit or the Nmax between aSOD2-KO males and females compared with respective controls. Colored bars represent the following: males, blue; females, red; aSOD2-KO, shaded. Error bars depict the mean ± SEM. Significance was tested using unpaired Student's t test (*p < 0.05; **p < 0.01).