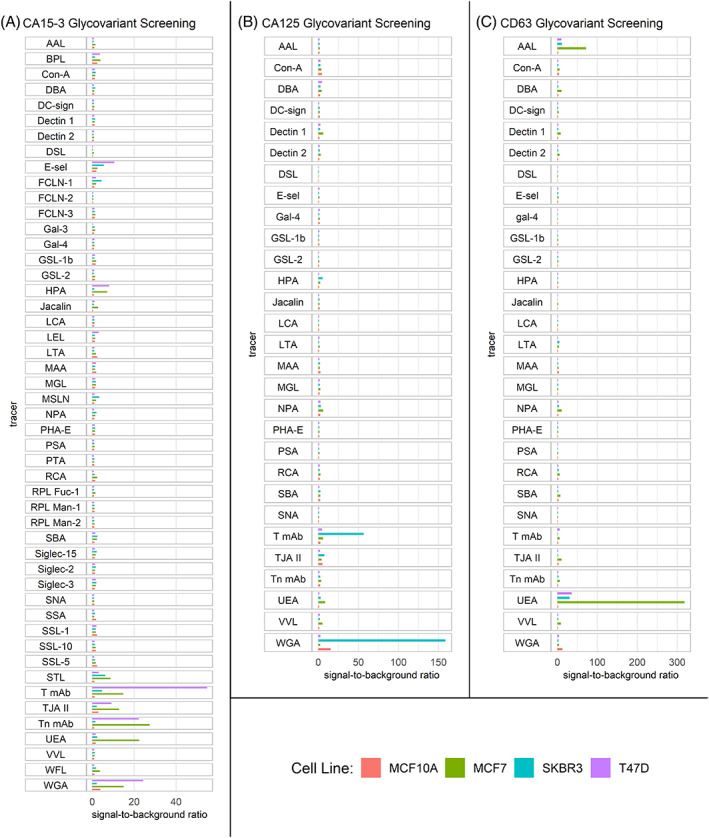
FIGURE 2.

Glycovariant biomarker screening results. Signal‐to‐background ratios (S/B) from immobilizing antigens from breast cancer cell lines MCF7, SKBR3, and T47D, and breast epithelial cell line MCF10A and detecting with glycan‐specific fluorescent reporter molecules. (A) CA15‐3, (B) CA125, and (C) CD63 antigen glycovariant screening. Notice the different scale of x‐axes in (A), (B), and (C)
