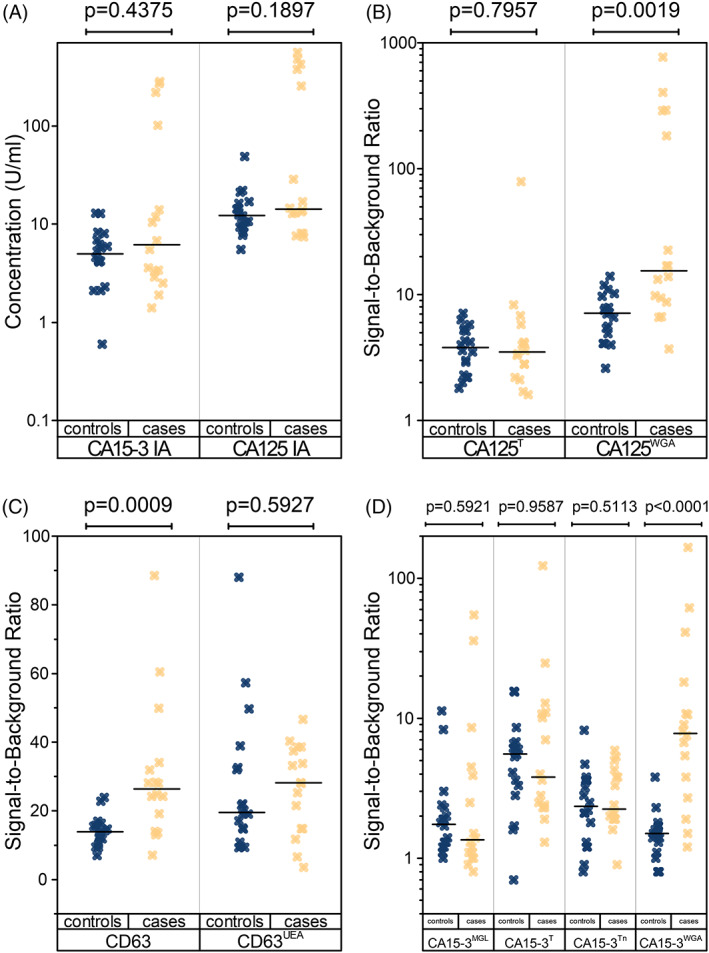
FIGURE 3.

Conventional and glycovariant assay results from clinical samples. Box plots of the (A) established conventional CA125 (CA125 IA), and CA15‐3 (CA15‐3 IA) assays, (B) CA125 glycovariant assays, (C) CD63 (CD63 IA), and CD63UEA assays, and (D) CA15‐3 glycovariant assays. The uncorrected p‐values on top of each plot are calculated with the Wilcoxon rank sum test. The significant p‐values (α = 0.05) remained significant after correction for multiple comparisons
