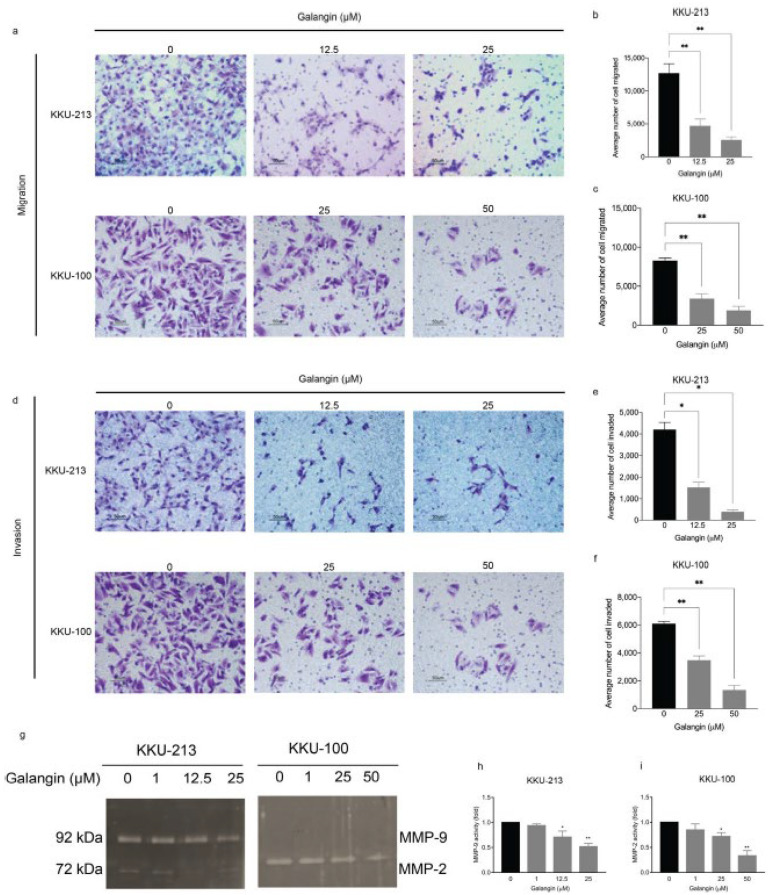
Figure 2.
Effect of Galangin on migration and invasion in KKU-213 and KKU-100 CCA cells. Transwell assay was used to detect cell migration and invasion. Images were taken at 20× magnification. Images of (a) cell migration, each cell group treated with various of Galangin, and their respective quantifications in (b) KKU-213 and (c) KKU-100 cells. Images of (d) cell invasion showing each cell group treated with various amounts of Galangin, and their respective quantifications in (e) KKU-213 and (f) KKU-100 cells. (g) Representative images of the gelatin zymography and (h) quantification the band intensity of MMP-9 activity in KKU-213 and (i) quantification of the band intensity of MMP-2 activity in KKU-100 after Galangin treatment in various concentrations. * p ≤ 0.05, ** p ≤ 0.01.

