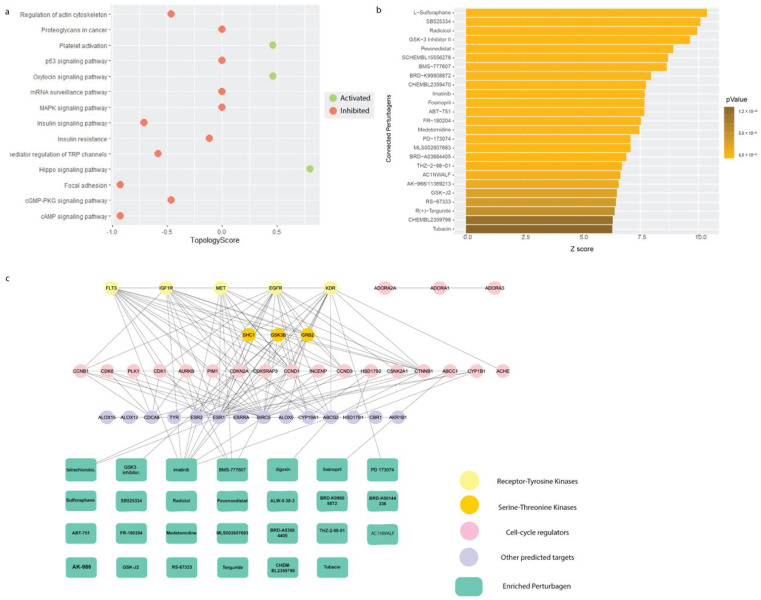
Figure 4.
Pathway enrichment and pharmaco-connectivity analysis of the DEP signature. (a) Signaling pathway impact analysis (SPIA) of the DEP signature. Green nodes represent pathways that are activated (topology score > 0), and red nodes represent pathways that are inhibited (topology score < 0). (b) Significant positively connected perturbagens to the DEP signature, ranked by lowest p-value and highest Z-score. (c) Pharmaco-connectivity analysis between the positively connected perturbagens and the predicted targets of Galangin based on structural similarity.

