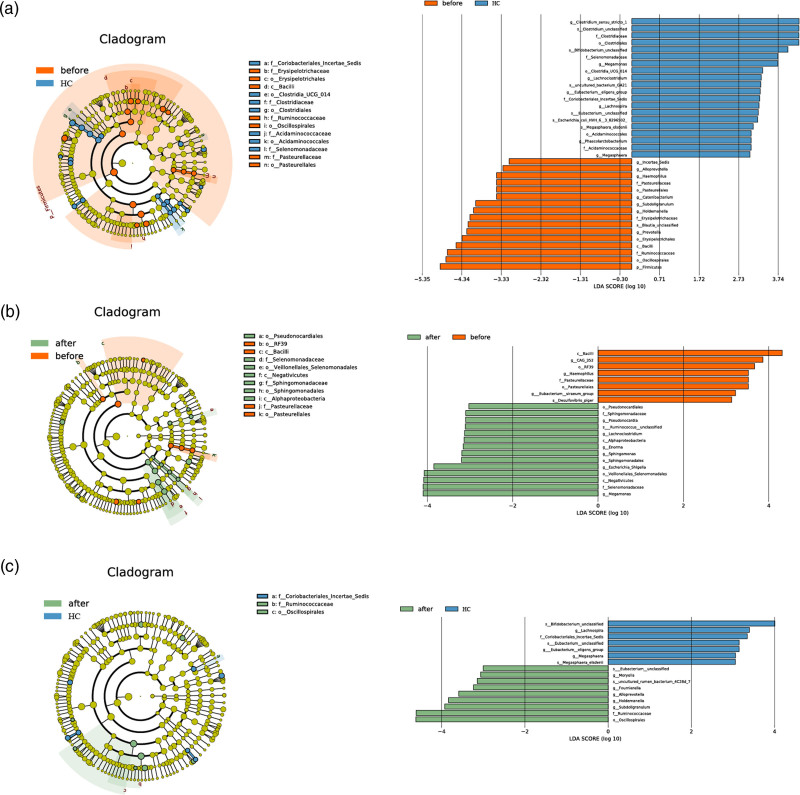
Fig. 4.
Microbiota differences among three groups. LefSe analysis illustrated the top differed microbiota components between pretreatment group (before) vs. healthy control (a), pretreatment group vs. posttreatment group (after) (b), and post-treatment group (after) vs. healthy control (c). log LDA >3 was defined as the cutoff for the identification of unique bacteria.

