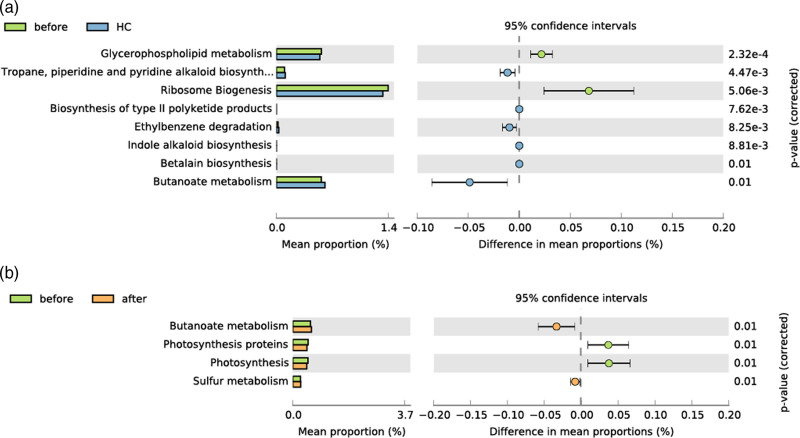
Fig. 5.
Functional prediction of altered pathways among the three groups. Pairwise PICRUSt analysis illustrated the top affected pathways between the (a) pretreatment group (before) vs. healthy control, (b) and pretreatment group vs. post-treatment group (after). The results were considered to be statistically significant with P < 0.01.

