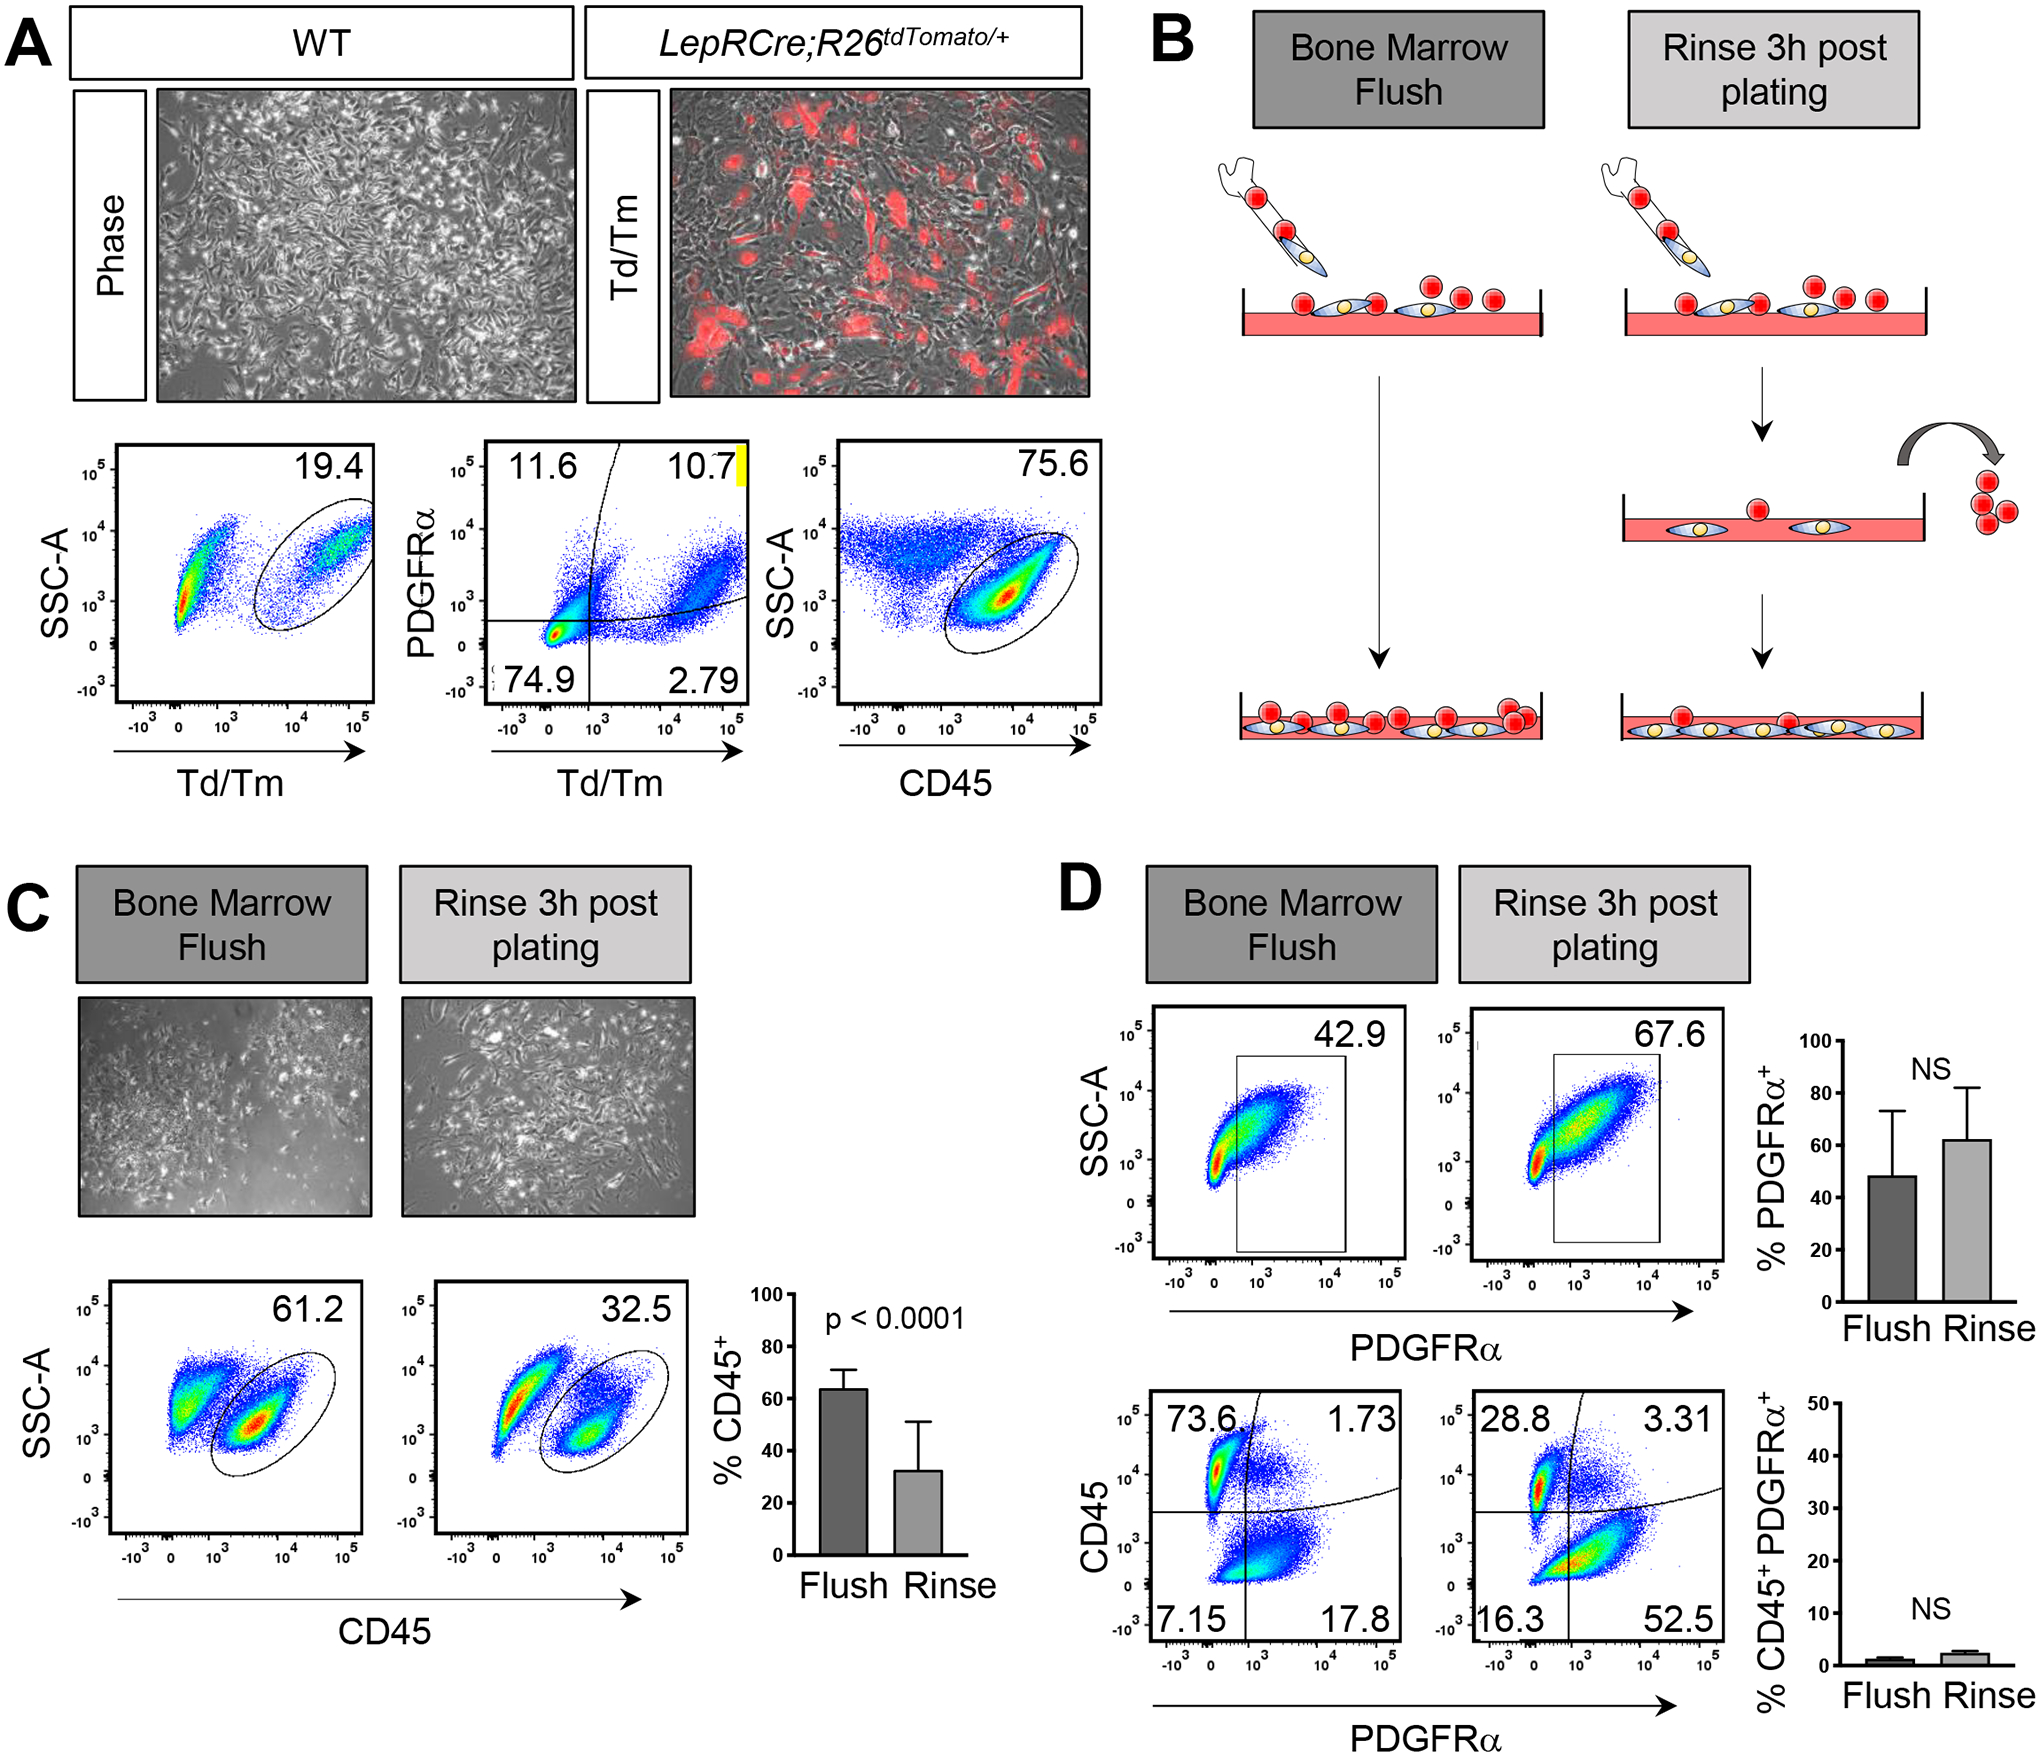
FIG 1. CD45+ cells constitute the majority of cells in BMSC cultures.

A) Phase contrast and overlay of immunofluorescent images of BMSCs isolated from LepRCre;Rosa26tdTm/+ mice. Red depicts cells in which CRE recombinase is active. Representative flow analysis plots and quantification of the percentage of CD45+, tdTomato+ (Td/Tm), and PDGFRα+;tdTomato+ double positive cells isolated from LepRCre;Rosa26tdTm/+ mice. B) Schematic representation of isolation methods. C) Phase contrast images of passage 0 BMSCs after 7 days in culture. Representative flow analysis plots and quantification of the percentage C) CD45+, D) PDGFRα+, and PDGFRα+;CD45+ double positive cells in WT BMSCs. Each graph represents an individual trial using BMSCs isolated from 2–3 month male and female mice. n≥3, unpaired two tailed t-tests, significance p < 0.05.
