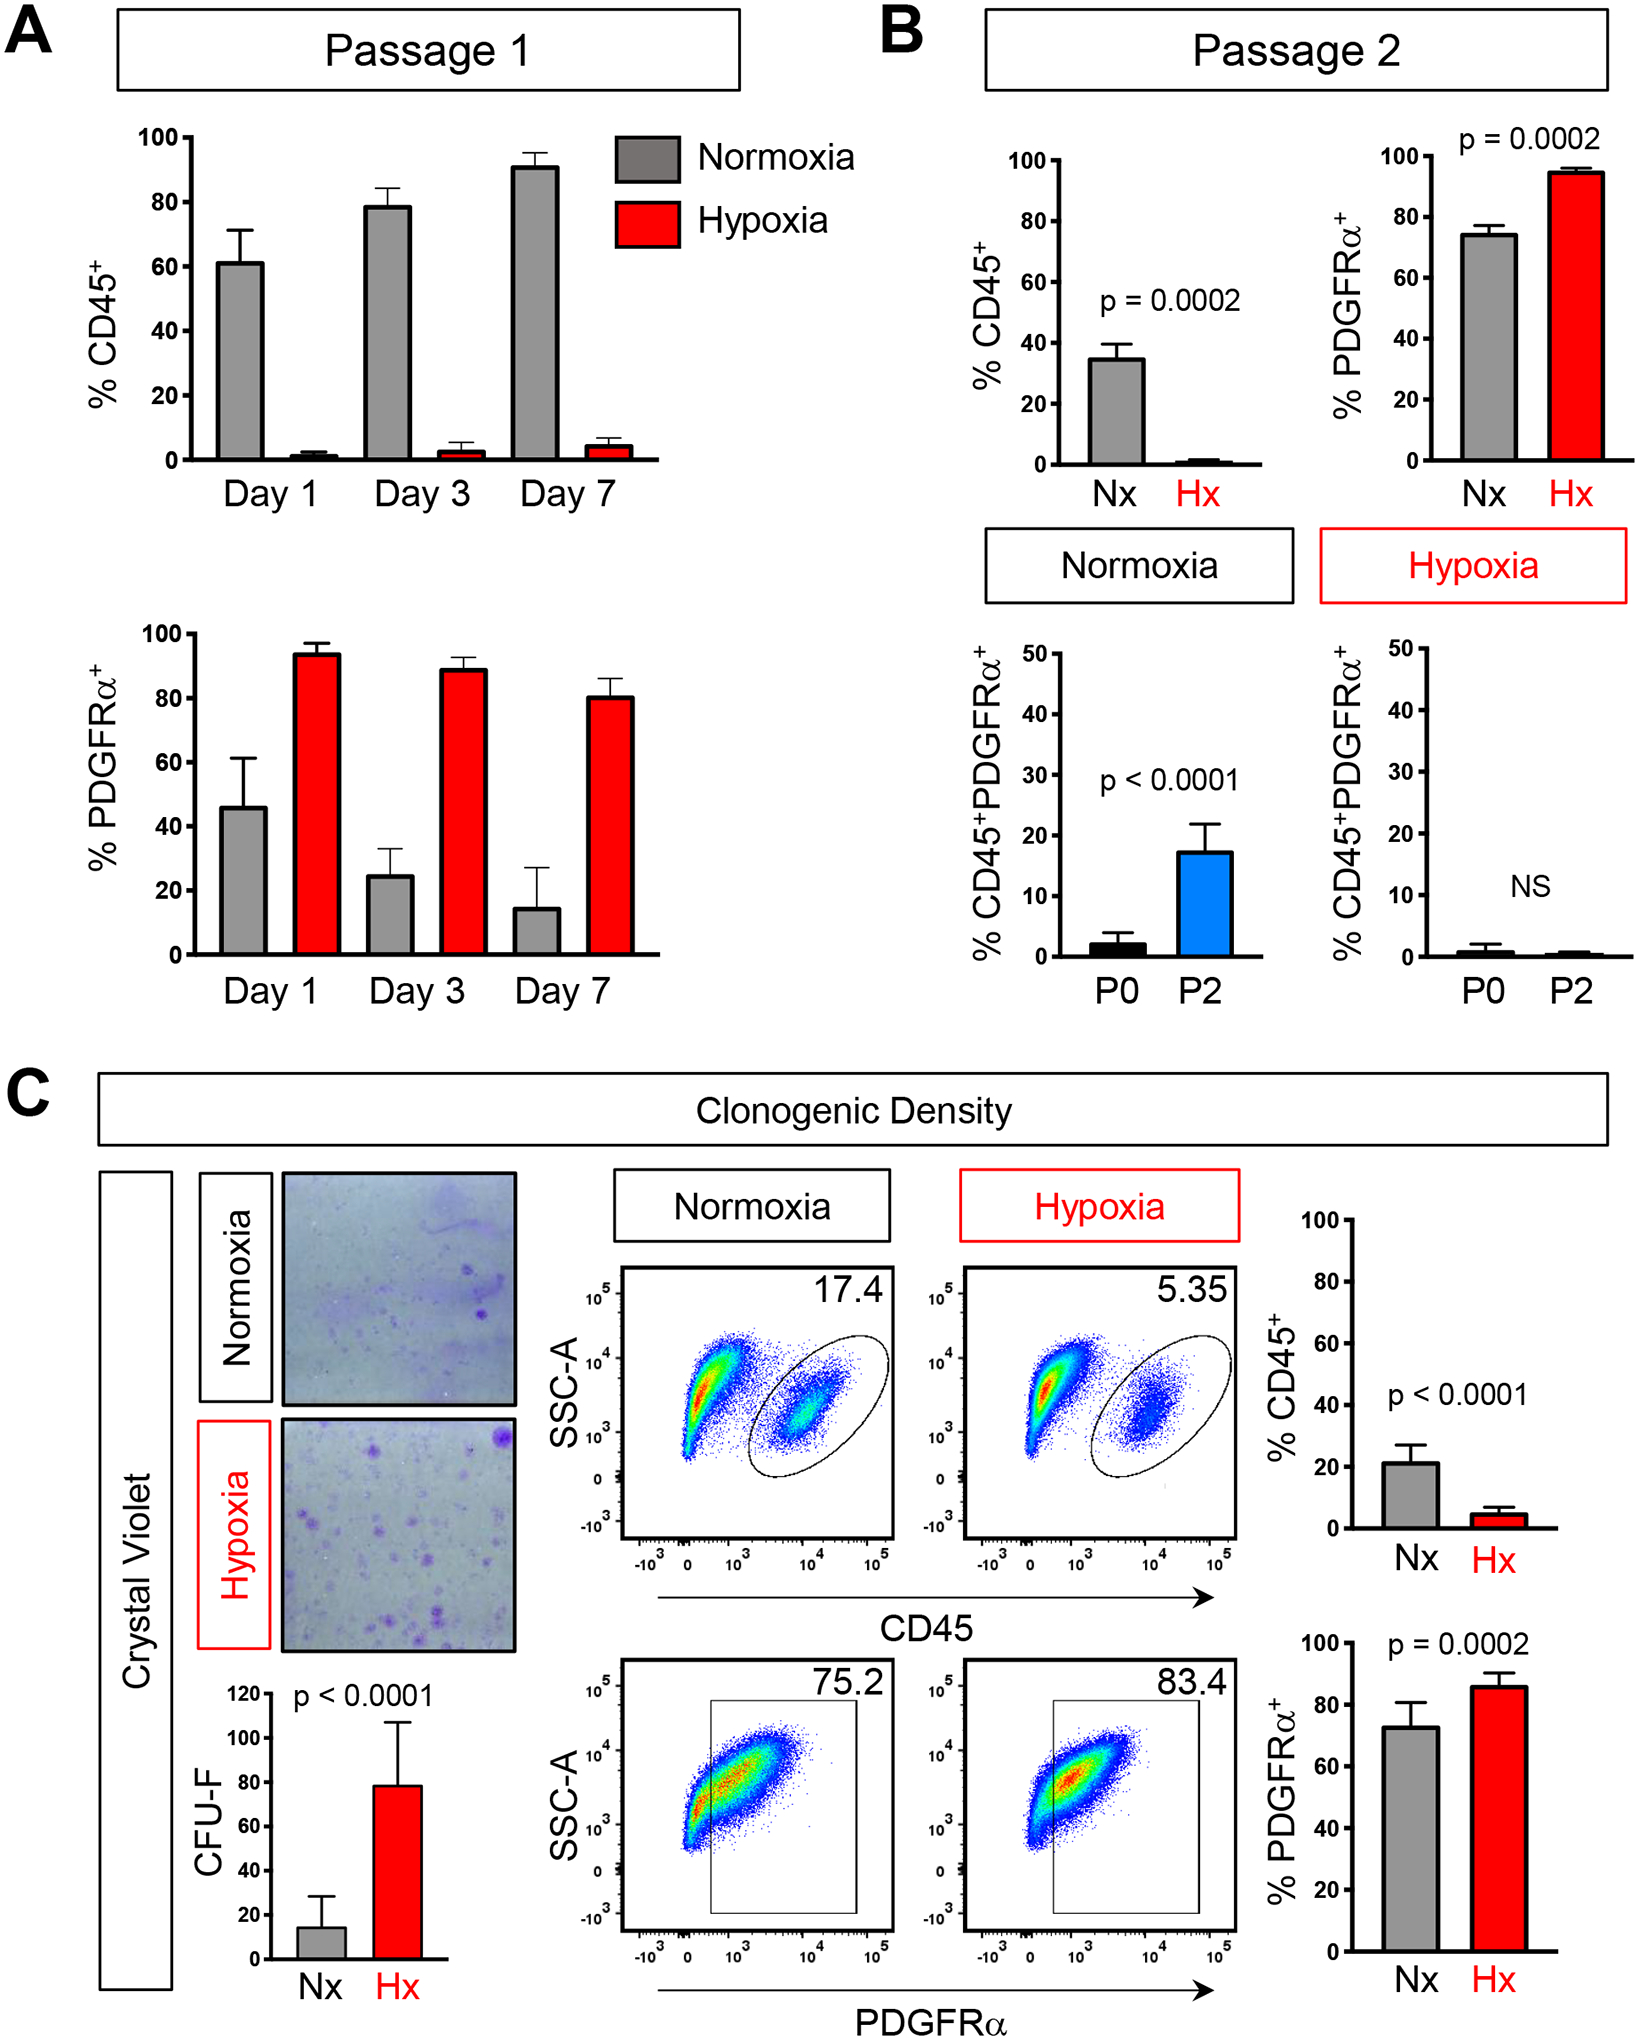
FIG 3. Hypoxic depletion of CD45+ cells is maintained over time and passage number.

A) Quantification of flow analysis showing the percentage of CD45+ and PDGFRα cells over 7 days in either normoxia (grey) or hypoxia (red). B) Quantification of the percentage of CD45+, PDGFRα+, and CD45+;PDGFRα+ double positive cells after two passages. C) Crystal violet staining and quantification of BMSCs plated at clonogenic density (left) and representative flow analysis plots and quantification of the percentage of CD45+ and PDGFRα+ (right). Each graph represents an individual trial using BMSCs isolated from 2–3M male mice were used for analysis, n≥3, unpaired two tailed t-tests, significance p < 0.05
