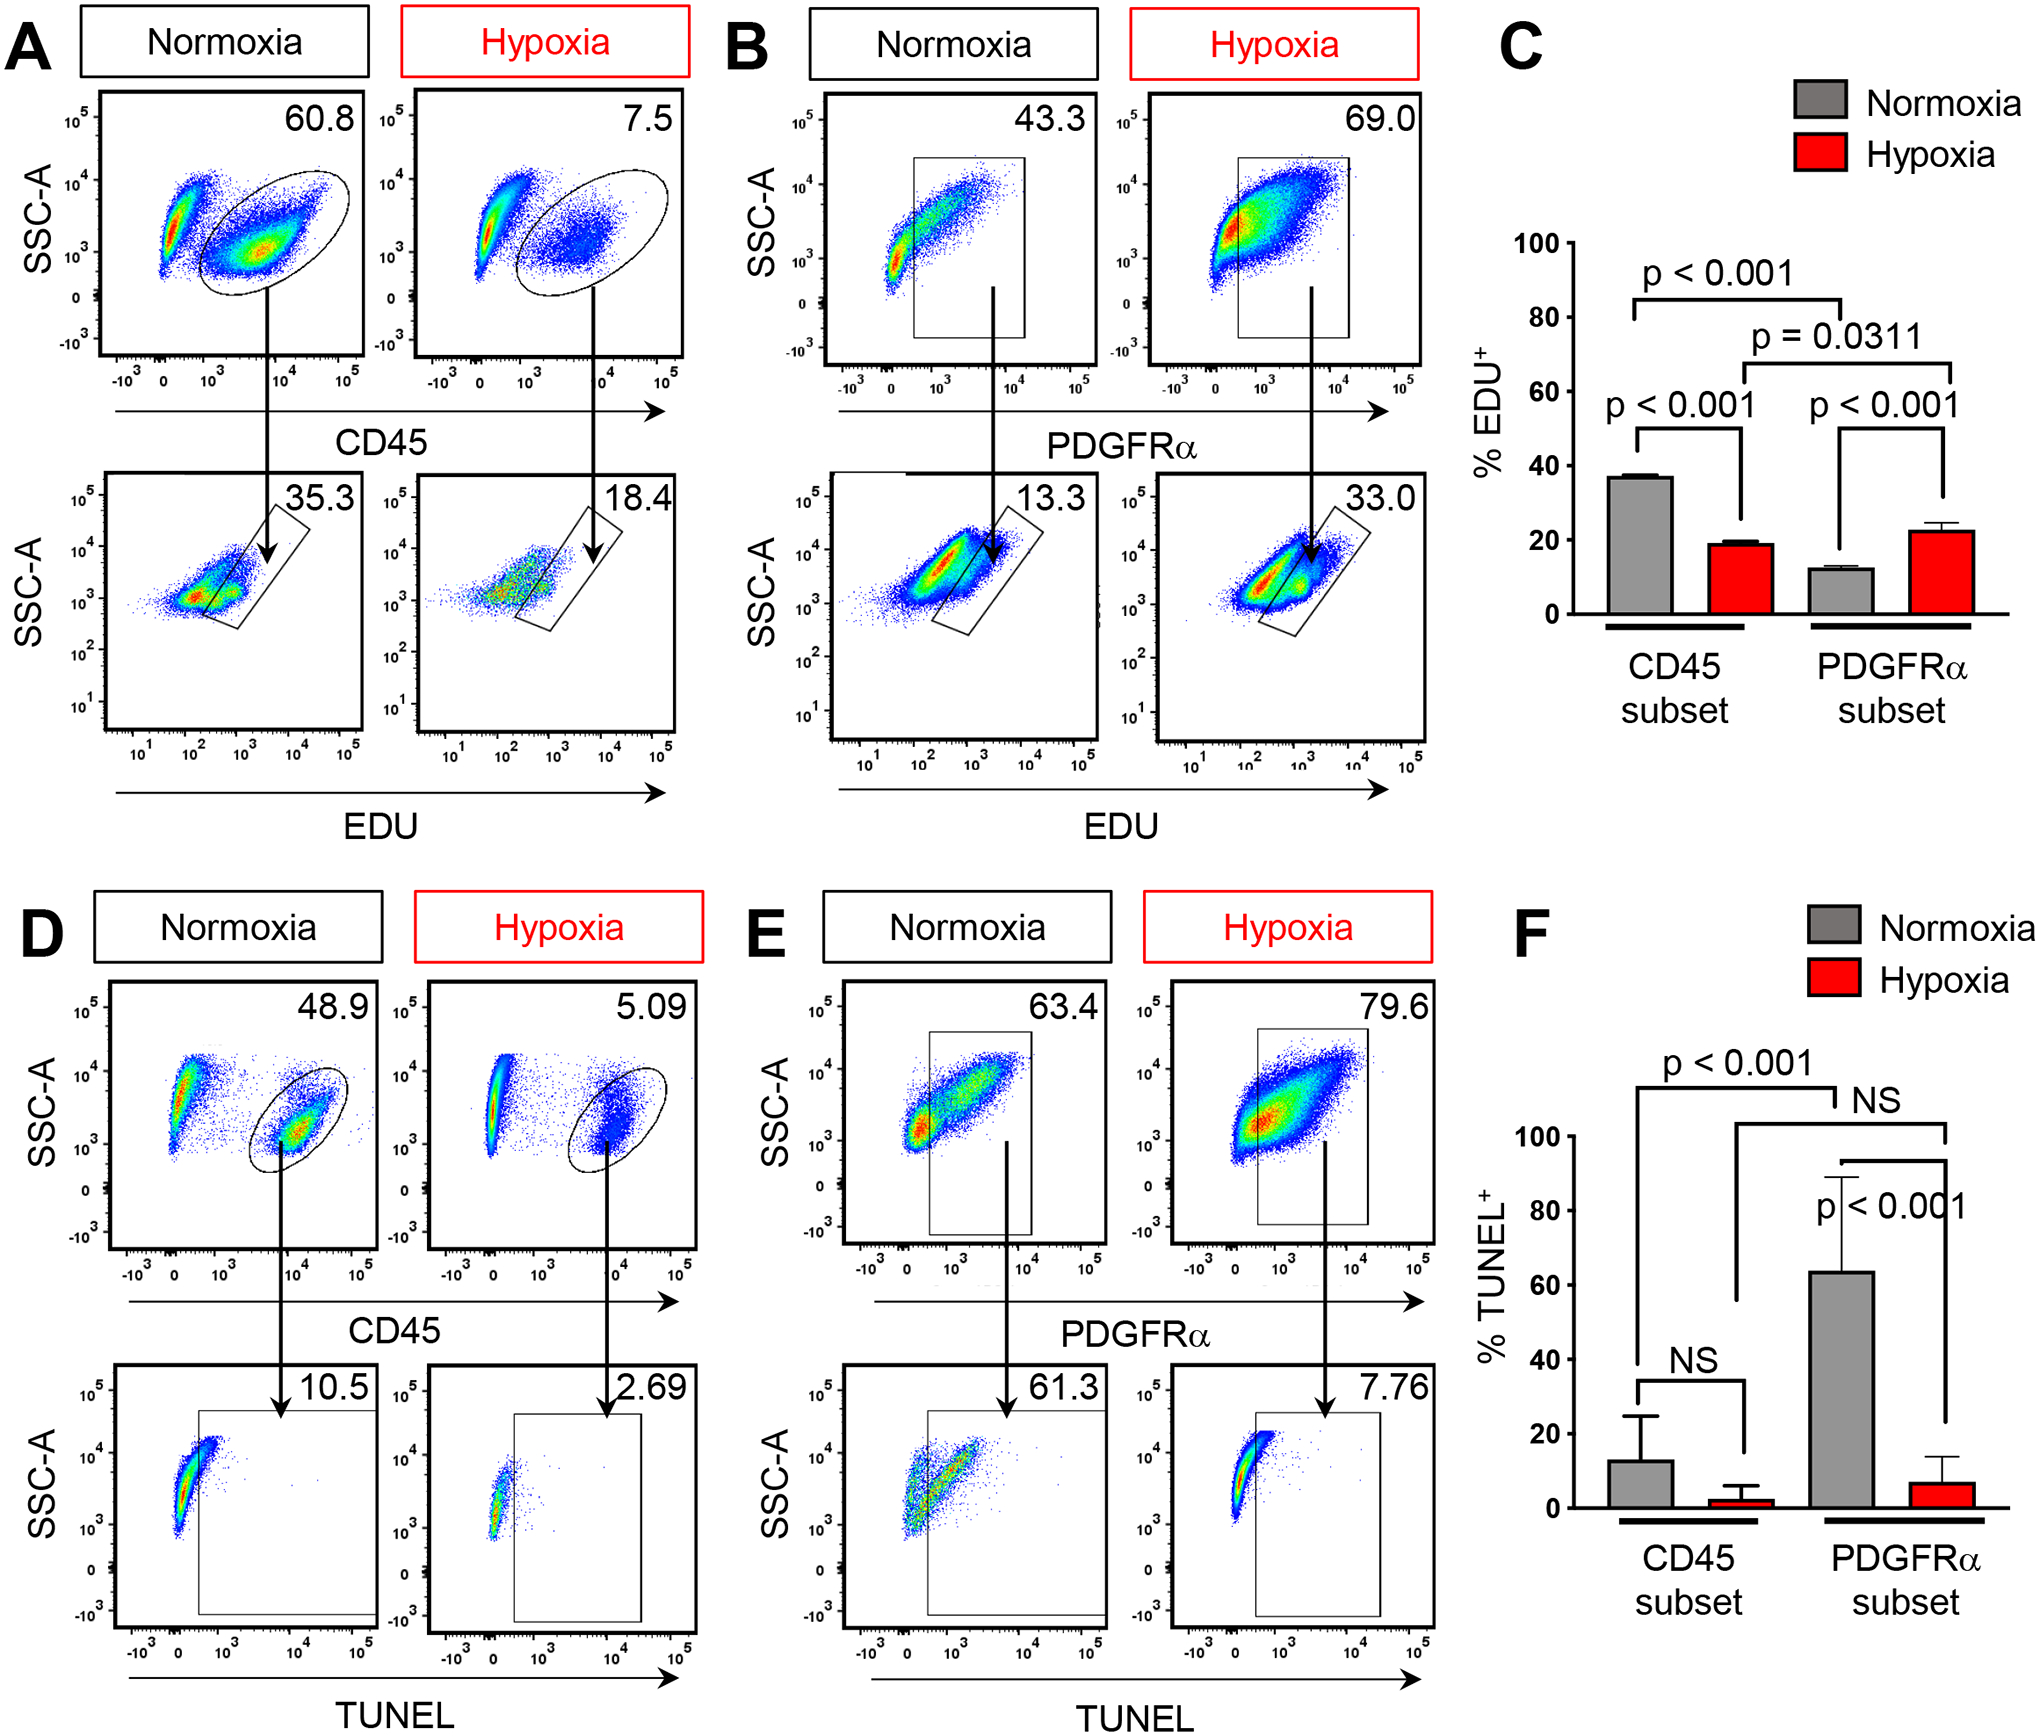
Figure 4. Differential effect of hypoxia on proliferation and apoptosis within CD45 and PDGFRα subsets.

A) Representative flow analysis plots of CD45+ cells or B) PDGFRα+ and percentage of cells which have incorporated EdU C) Quantification of flow analysis for CD45+;EdU+ and PDGFRα+;EdU+ cells. D) Representative flow analysis plots of CD45+ cells or E) PDGFRα+ and percentage of TUNEL+ cells F) Quantification of flow analysis for CD45+;TUNEL+ and PDGFRα+;TUNEL+ cells. BMSCs isolated from 2–3M old male and female mice, n≥3 for each condition. One-way ANOVA, post-hoc Tukey’s multiple comparisons test, significance p < 0.05.
