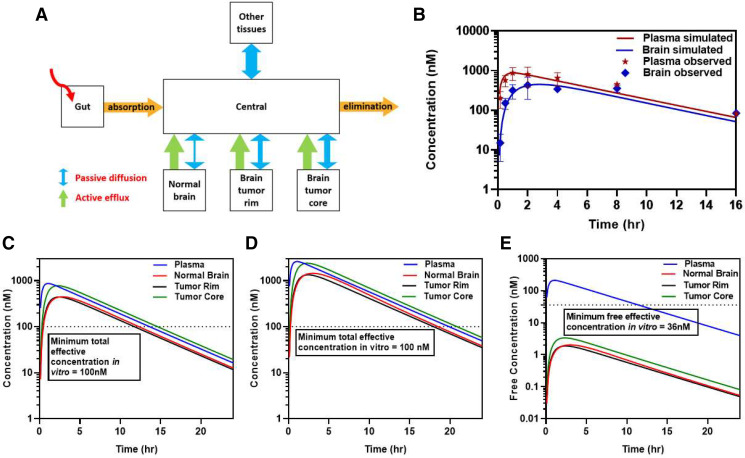
Fig. 10.
Pharmacokinetic modeling to predict exposure of berzosertib in plasma and different regions of the brain. (A) Schematic of the pharmacokinetic model. (B) Simulated plasma and brain concentrations overlayed with observed pharmacokinetic data for 20-mg/kg dose. (C) Simulated plasma, brain, tumor rim, and tumor core total concentrations for 20-mg/kg dose. (D) Simulated plasma, brain, tumor rim, and tumor core total concentrations for 60-mg/kg dose. (E) Simulated plasma, brain, tumor rim, and tumor core free concentrations for 60-mg/kg dose.

