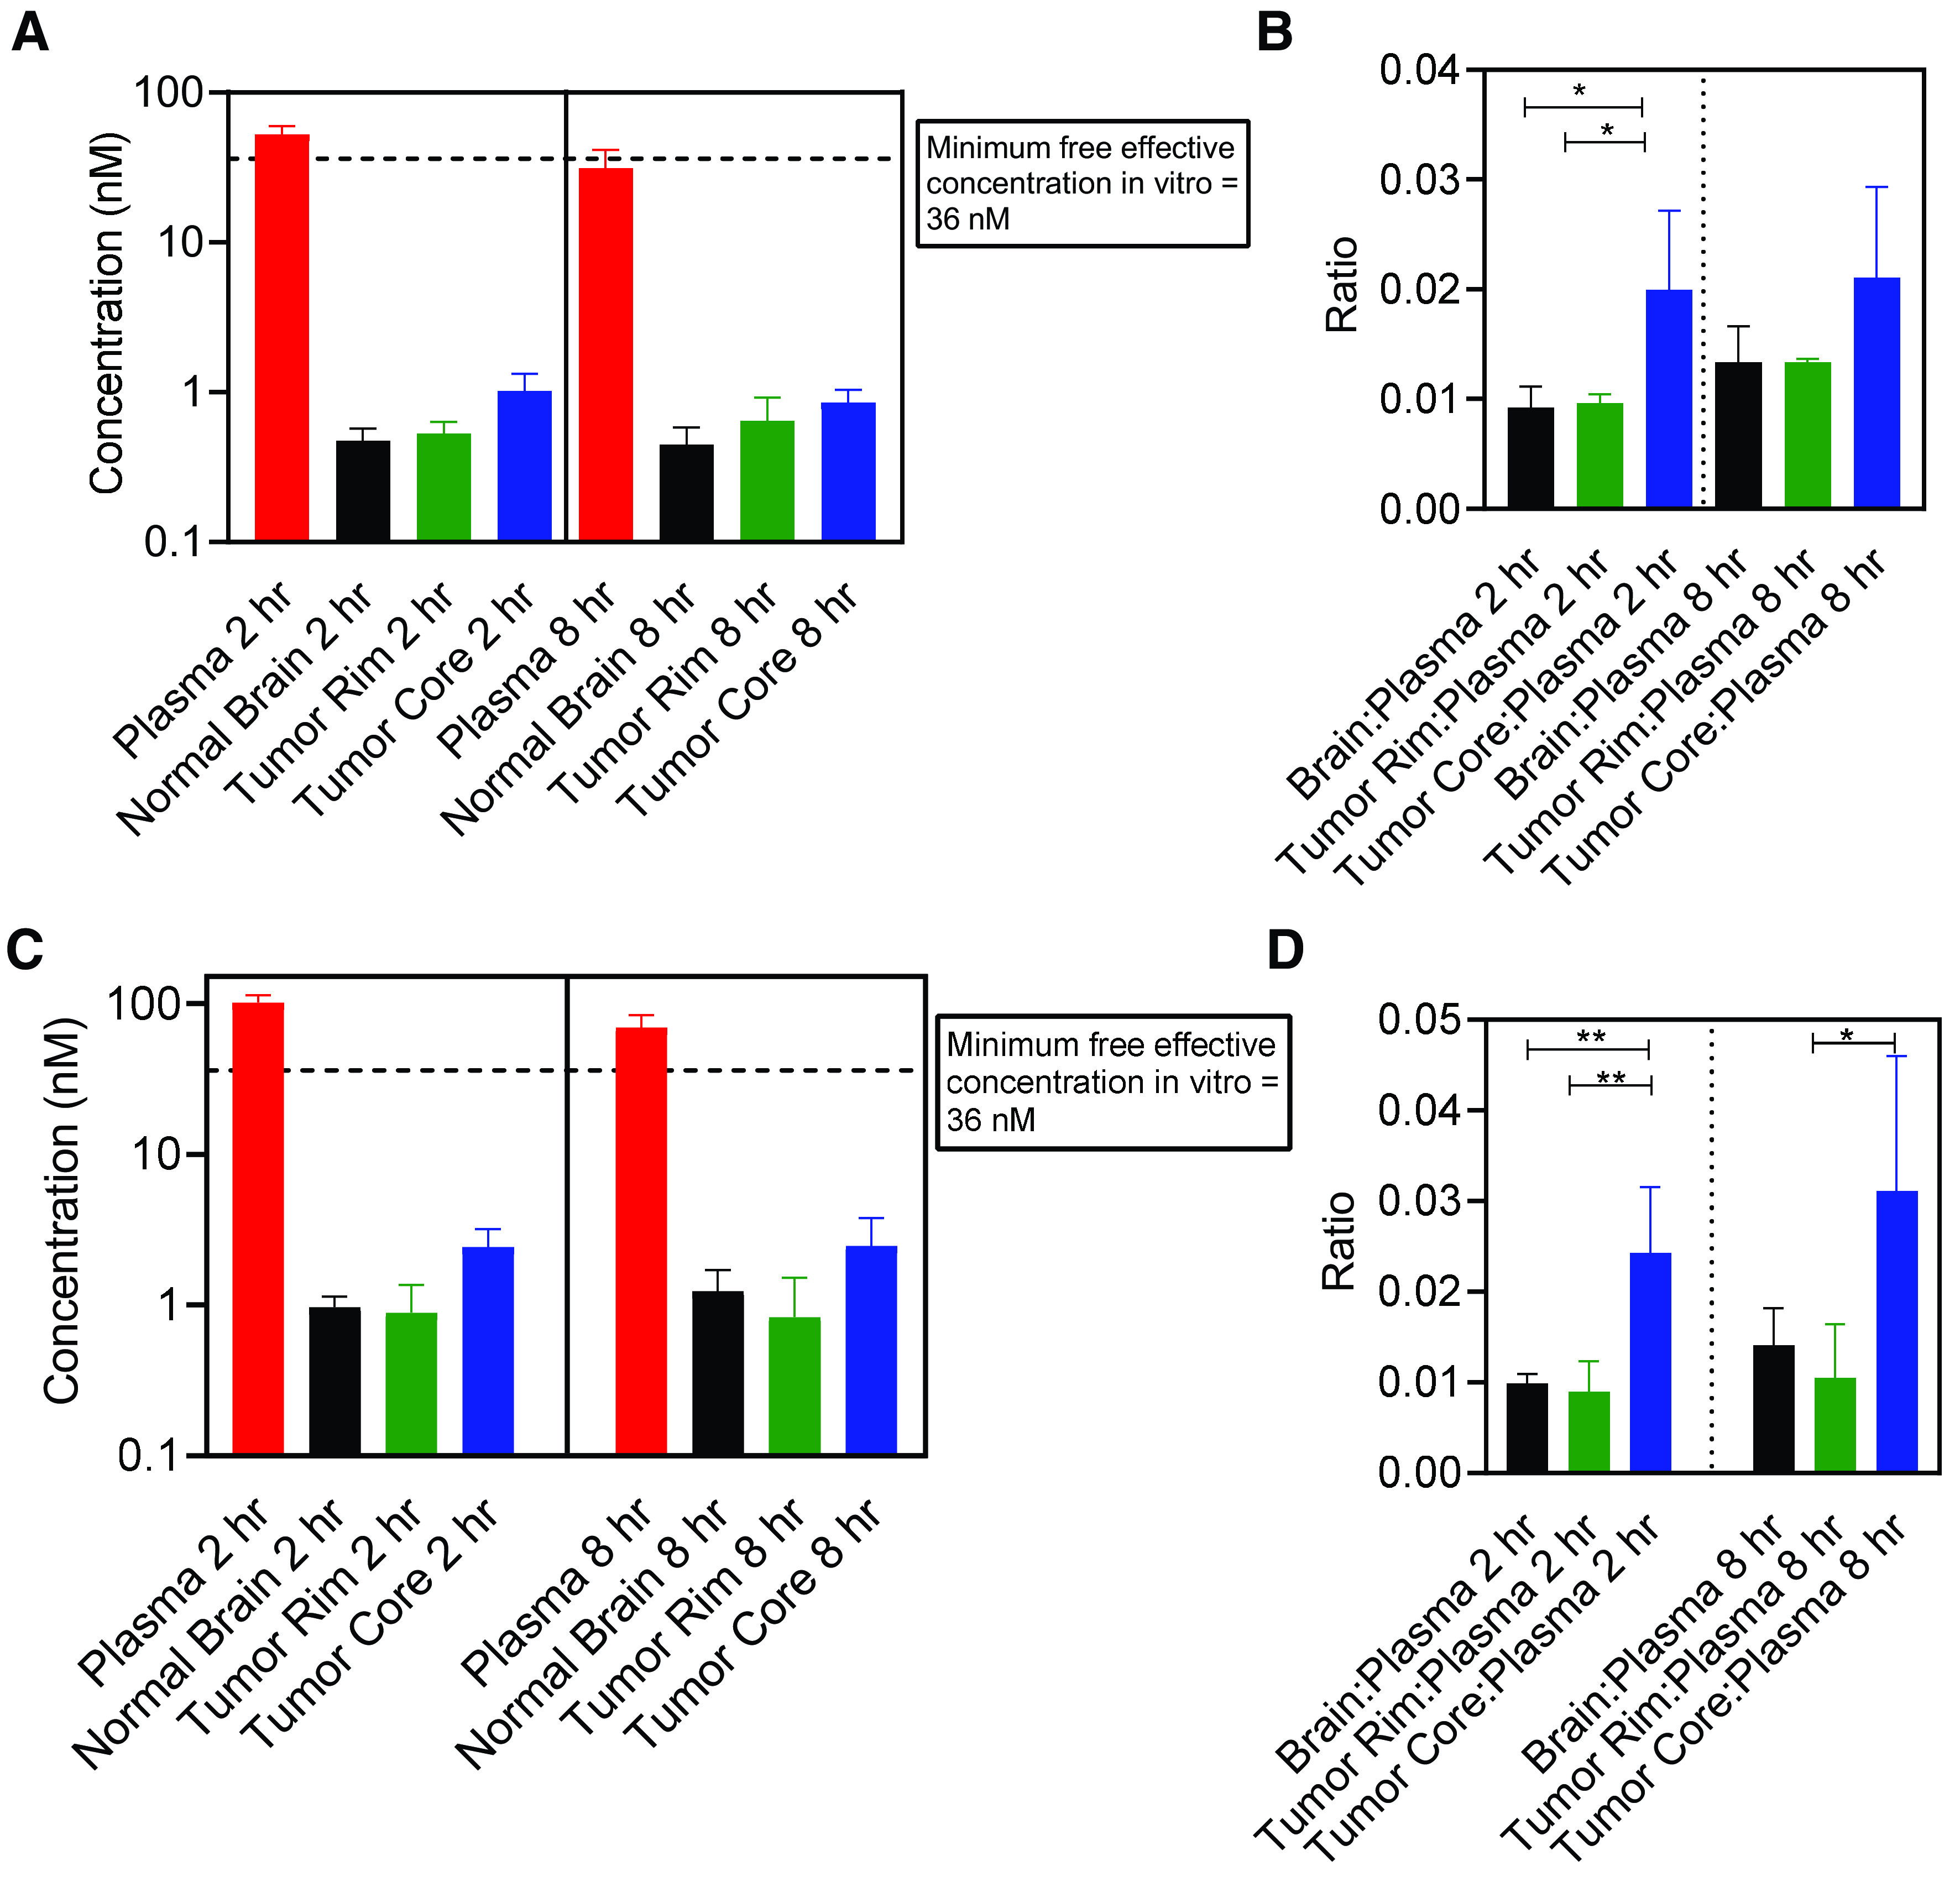
Fig. 9.

Free/unbound spatial distribution of berzosertib in different regions of the brain after oral administration in mice with GBM 12 intracranial tumors. Data represent mean ± S.D., n = 4–5. *P < 0.05 and **P < 0.01. (A) Free/unbound concentrations in plasma, normal brain, tumor rim, and tumor core and (B) free/unbound concentration ratios in brain, tumor rim, and tumor core with respect to plasma after a dose of 20 mg/kg. (C) Free/unbound concentrations in plasma, normal brain, tumor rim, and tumor core and (D) free/unbound concentration ratios in brain, tumor rim, and tumor core with respect to plasma after a dose of 60 mg/kg.
