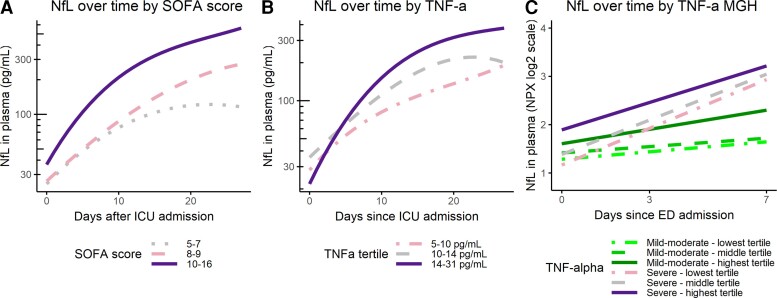
Figure 5.
NfL in relation to other factors. Analysed using linear mixed models, the lowest tertile group of the factor of interest acting as reference group. Marginal means to test the days when slopes differed significantly between the tertile groups (A) SOFA score in the AmsterdamUMC cohort (average score over the first 3 days of admission used). Slopes differ significantly between lowest and highest tertile from Day 8 onwards (t-ratio = −2.55, P = 0.04). (B) TNF-α in the AmsterdamUMC cohort. Slopes differ significantly between the highest and middle tertile from Day 0 until Day 6 (t-ratio = −2.38, P = 0.05, t-ratio = −2.42, P = 0.05, respectively), between the highest and lowest tertile between Day 2 and Day 8 (t-ratio = −2.64, P = 0.02 and t-ratio = −2.66, P = 0.03, respectively). (C) TNF-α in the MGH cohort. Linear mixed model: mild-moderate COVID-19 group lowest tertile used as reference group (t-value = 2.09, P = 0.04). Severe COVID-19 lower tertile (t-value = 5.77), middle tertile (t-value = 5.15), upper tertile (t-value = 4.23), all P-values < 0.001. Using marginal means, the differences in slopes per group were analysed. The severe COVID-19 tertile groups had significantly steeper slopes than the mild-moderate COVID-19 tertiles groups (t-ratio between −6.30 and −2.91, all P-values < 0.01), except the slope of the highest mild-moderate COVID-19 tertile did not differ from the highest severe COVID-19 tertile (t-ratio −2.57, P = 0.108).

