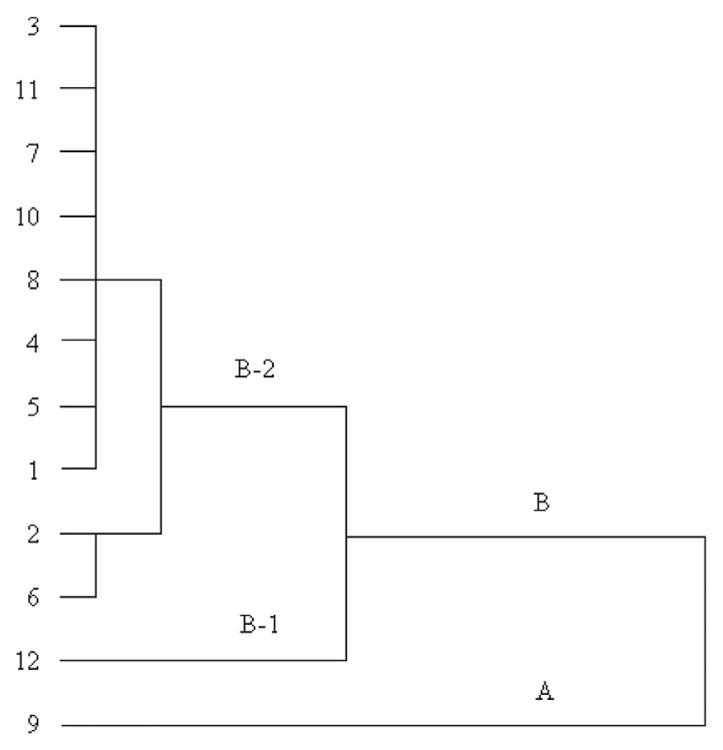
Fig. 2.
Dendrogram of HCA for the 12 batches of FTB samples. The 12 tested samples of FTB were divided into two main clusters, cluster A and cluster B. HCA was carried out using SPSS 13.0 software. Ward’s method was applied, and Squared Euclidean distance was selected as a measurement. FTB = Fritillariae Thunbergii Bulbus; HCA = hierarchical clustering analysis.

