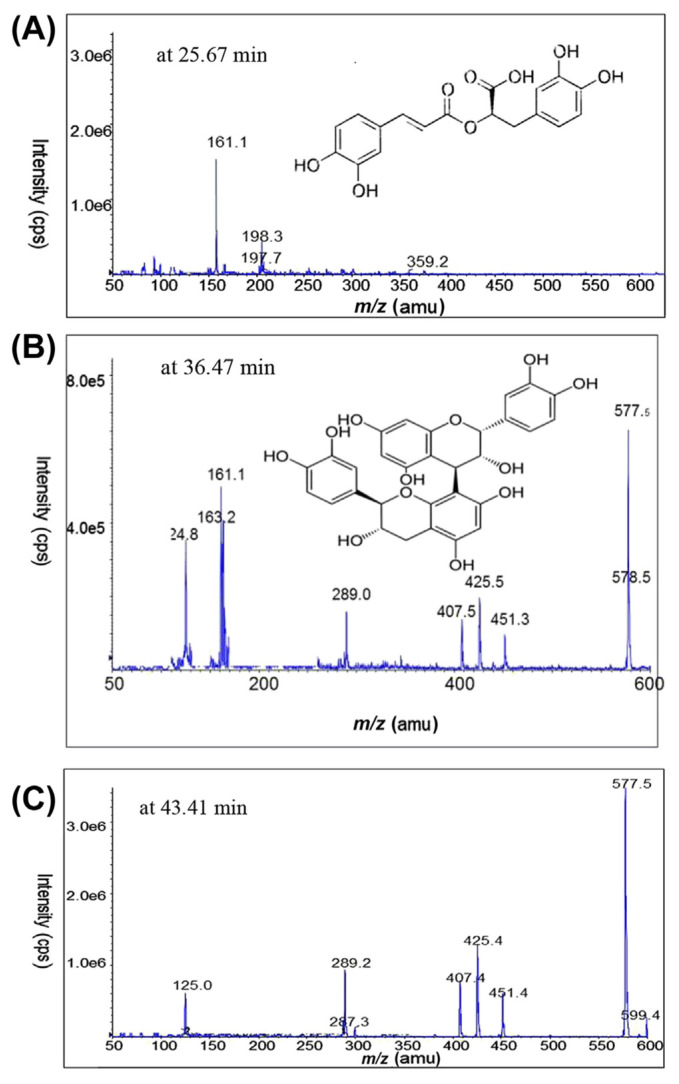
Fig. 3.
HPLC–MS/MS product ion scan spectra of (A) compound a, rosmarinic acid (m/z 359.2); (B) compound b, procyanidin B1 (m/z 577.5); and (C) ion fragment of compound c. The sample analyzed was EAF of sarang semut extract (heat reflux extraction, 3 hours, water/ethanol; 20/80; v/v), in negative ion mode. EAF = ethyl acetate fraction; HPLC = high-performance liquid chromatography; MS/MS = tandem mass spectrometry.

