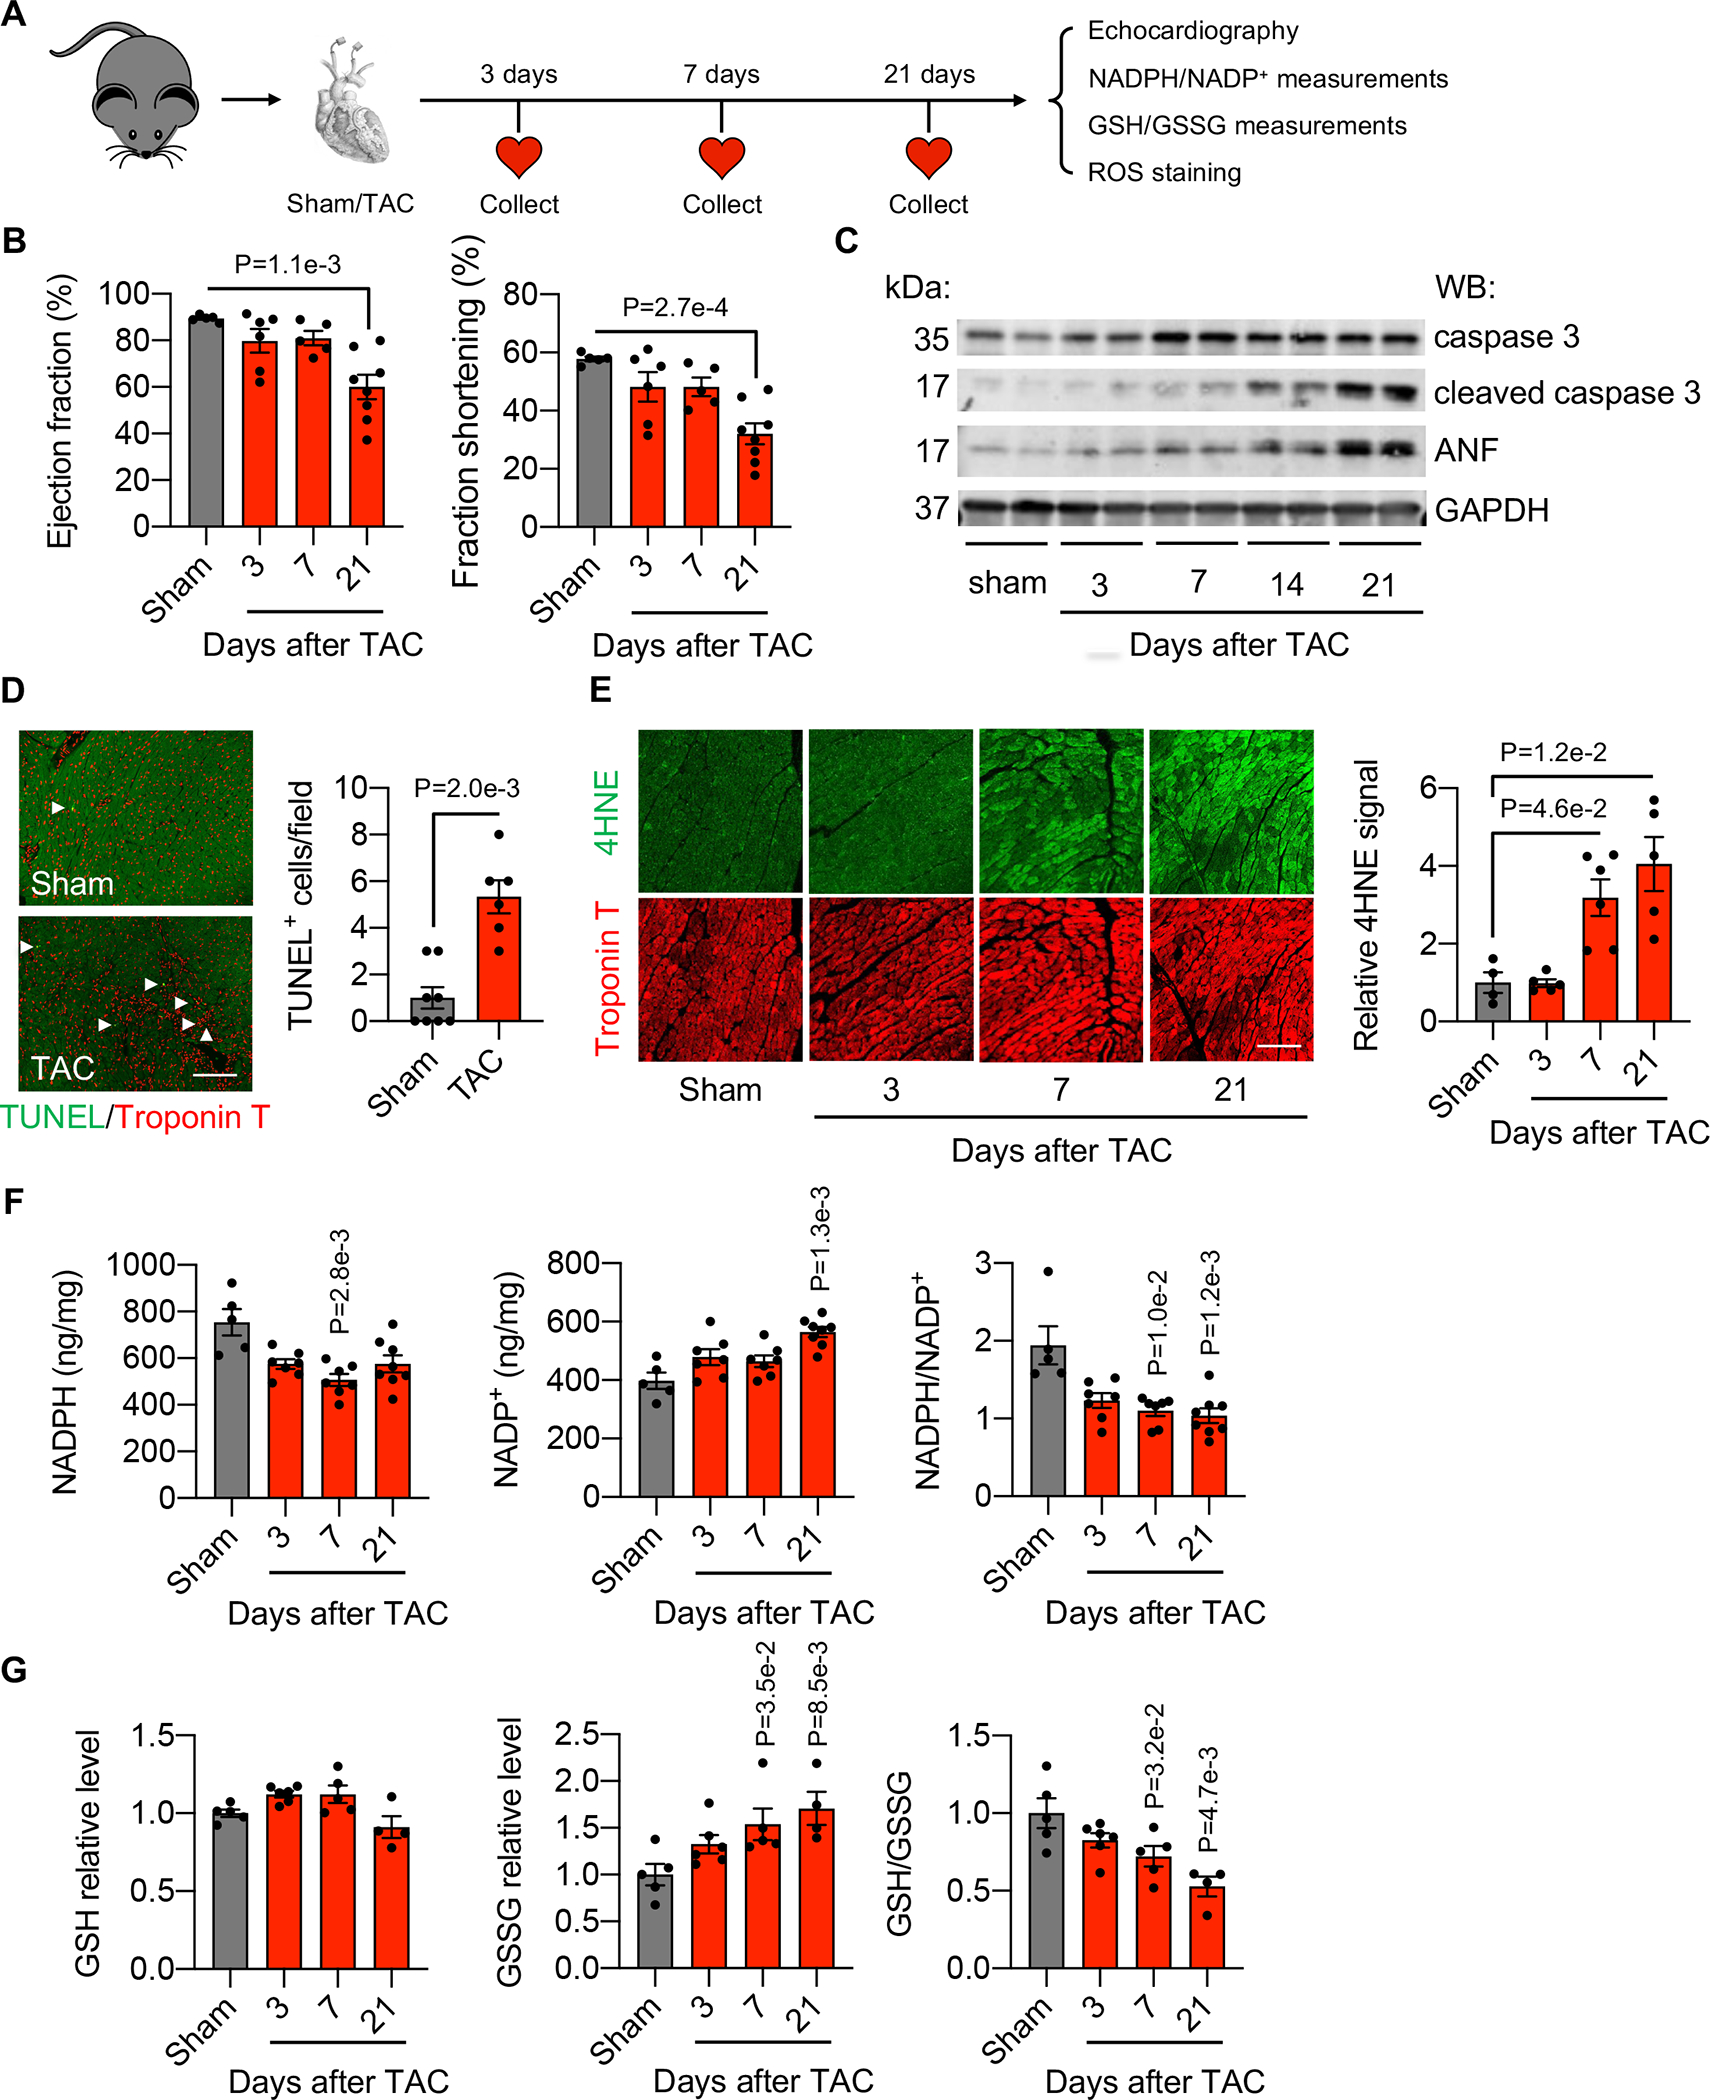
Figure 1. Oxidative stress is elevated by pressure overload-induced heart failure.

A. Schematic of experimental design. Wild-type C57BL/6 mice were subjected to sham or transverse aortic constriction (TAC). A series of measurements were made 3, 7, and 21 days after TAC. NADPH, reduced nicotinamide adenine dinucleotide phosphate; NADP+, nicotinamide adenine dinucleotide phosphate; GSSG, glutathione disulfide; GSH, glutathione; ROS, reactive oxygen species.
B. TAC caused cardiac dysfunction in mice. Ejection fraction and fractional shortening (%) were determined by echocardiography. Sham, n=5; 3 days after TAC, n=6; 7 days after TAC, n=5; 21 days after TAC, n=8.
C. Western blotting showed that cleaved caspase 3 and ANP were upregulated in the heart after TAC.
D. TUNEL (terminal deoxynucleotidyl transferase dUTP nick-end labeling) staining identified apoptotic cardiac cells 3 weeks after TAC. Scale: 100 μm. Sham, n=8; TAC, n=6.
E. The hypertrophied heart at 7 and 21 days after TAC showed an elevated level of 4-HNE (4-hydroxynonenal)-positive signal. Scale: 100 μm. N=4–6. Sham, n=4; 3 days after TAC, n=5; 7 days after TAC, n=6; 21 days after TAC, n=5.
F. Both NADPH level and the NADPH/NADP+ ratio were significantly decreased in mice 3, 7, and 21 days after TAC. NADP+ level was significantly increased in mice 3, 7, and 21 days after TAC. Sham, n=5; 3 days after TAC, n=7; 7 days after TAC, n=7; 21 days after TAC, n=8.
G. GSSG was increased in the heart 7 and 21 days after TAC. The GSH/GSSG ratio was decreased 7 and 21 days after TAC. Sham, n=5; 3 days after TAC, n=6; 7 days after TAC, n=5; 21 days after TAC, n=4.
Kruskal-Wallis test was conducted, followed by Dunnett’s test to determine statistical significance for comparisons of the means of each surgical group (3, 7, and 21 days after TAC) with the mean of the sham group (B, E-G). Unpaired Student’s t test was conducted for D. GSH (F) and GSSG (G) levels from each surgical group (3, 7, and 21 days after TAC) were normalized to the mean of the sham group, which was set to 1. Data are represented as mean±SEM.
