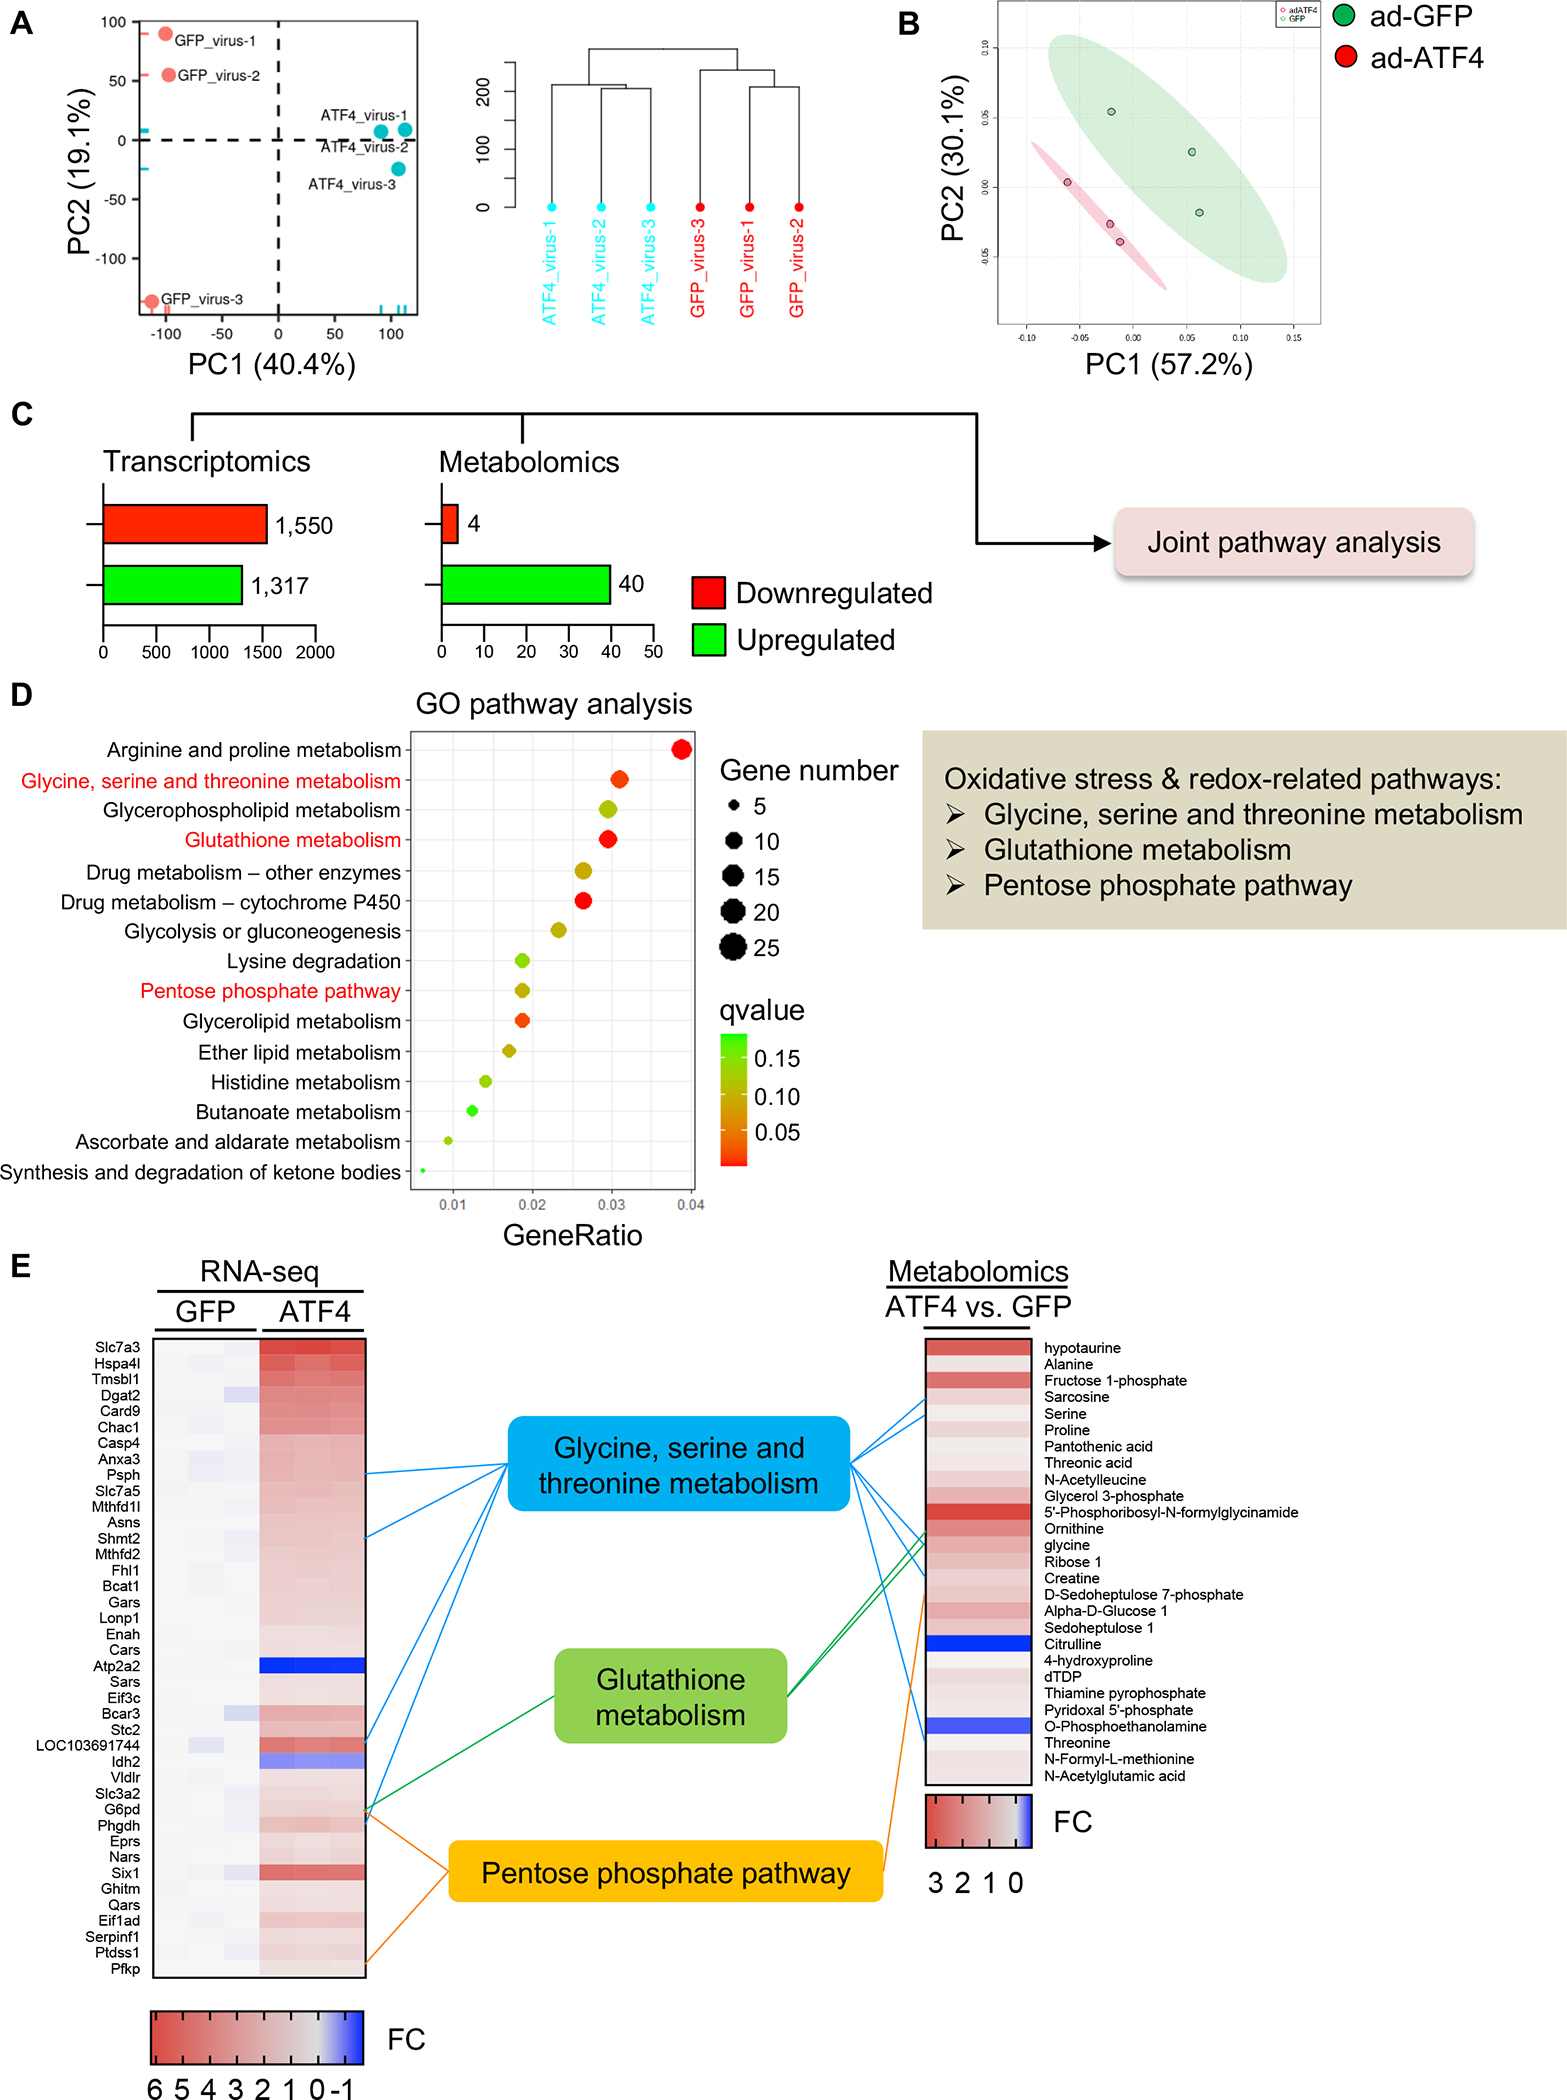
Figure 4. ATF4 controls the one-carbon metabolic pathway and PPP.

A. NRVMs were infected by adenoviruses expressing ATF4 or control GFP. RNA-sequencing was conducted and PCA analysis was performed. N=3 for each group.
B. Metabolomics were performed with NRVMs expressing control GFP or ATF4. N=3 for each group.
C. Significantly changed genes (RNA-sequencing) and metabolites (metabolomics) were subjected to the joint pathway analysis (JPA).
D. Multi-omics analysis using transcriptomic and metabolomic data was performed according to the analytical scheme shown in C. JPA was used to calculate the bubble chart, which is a combination of enrichment P values and gene numbers of individual pathways.
E. The top 40 transcripts (left, RNA-sequencing) and 27 metabolites (right, metabolomics) with cutoff threshold of fold change>1.2 or <0.8 and P value adjusted <0.05 are shown. FC, fold change.
