
Fig. 2.
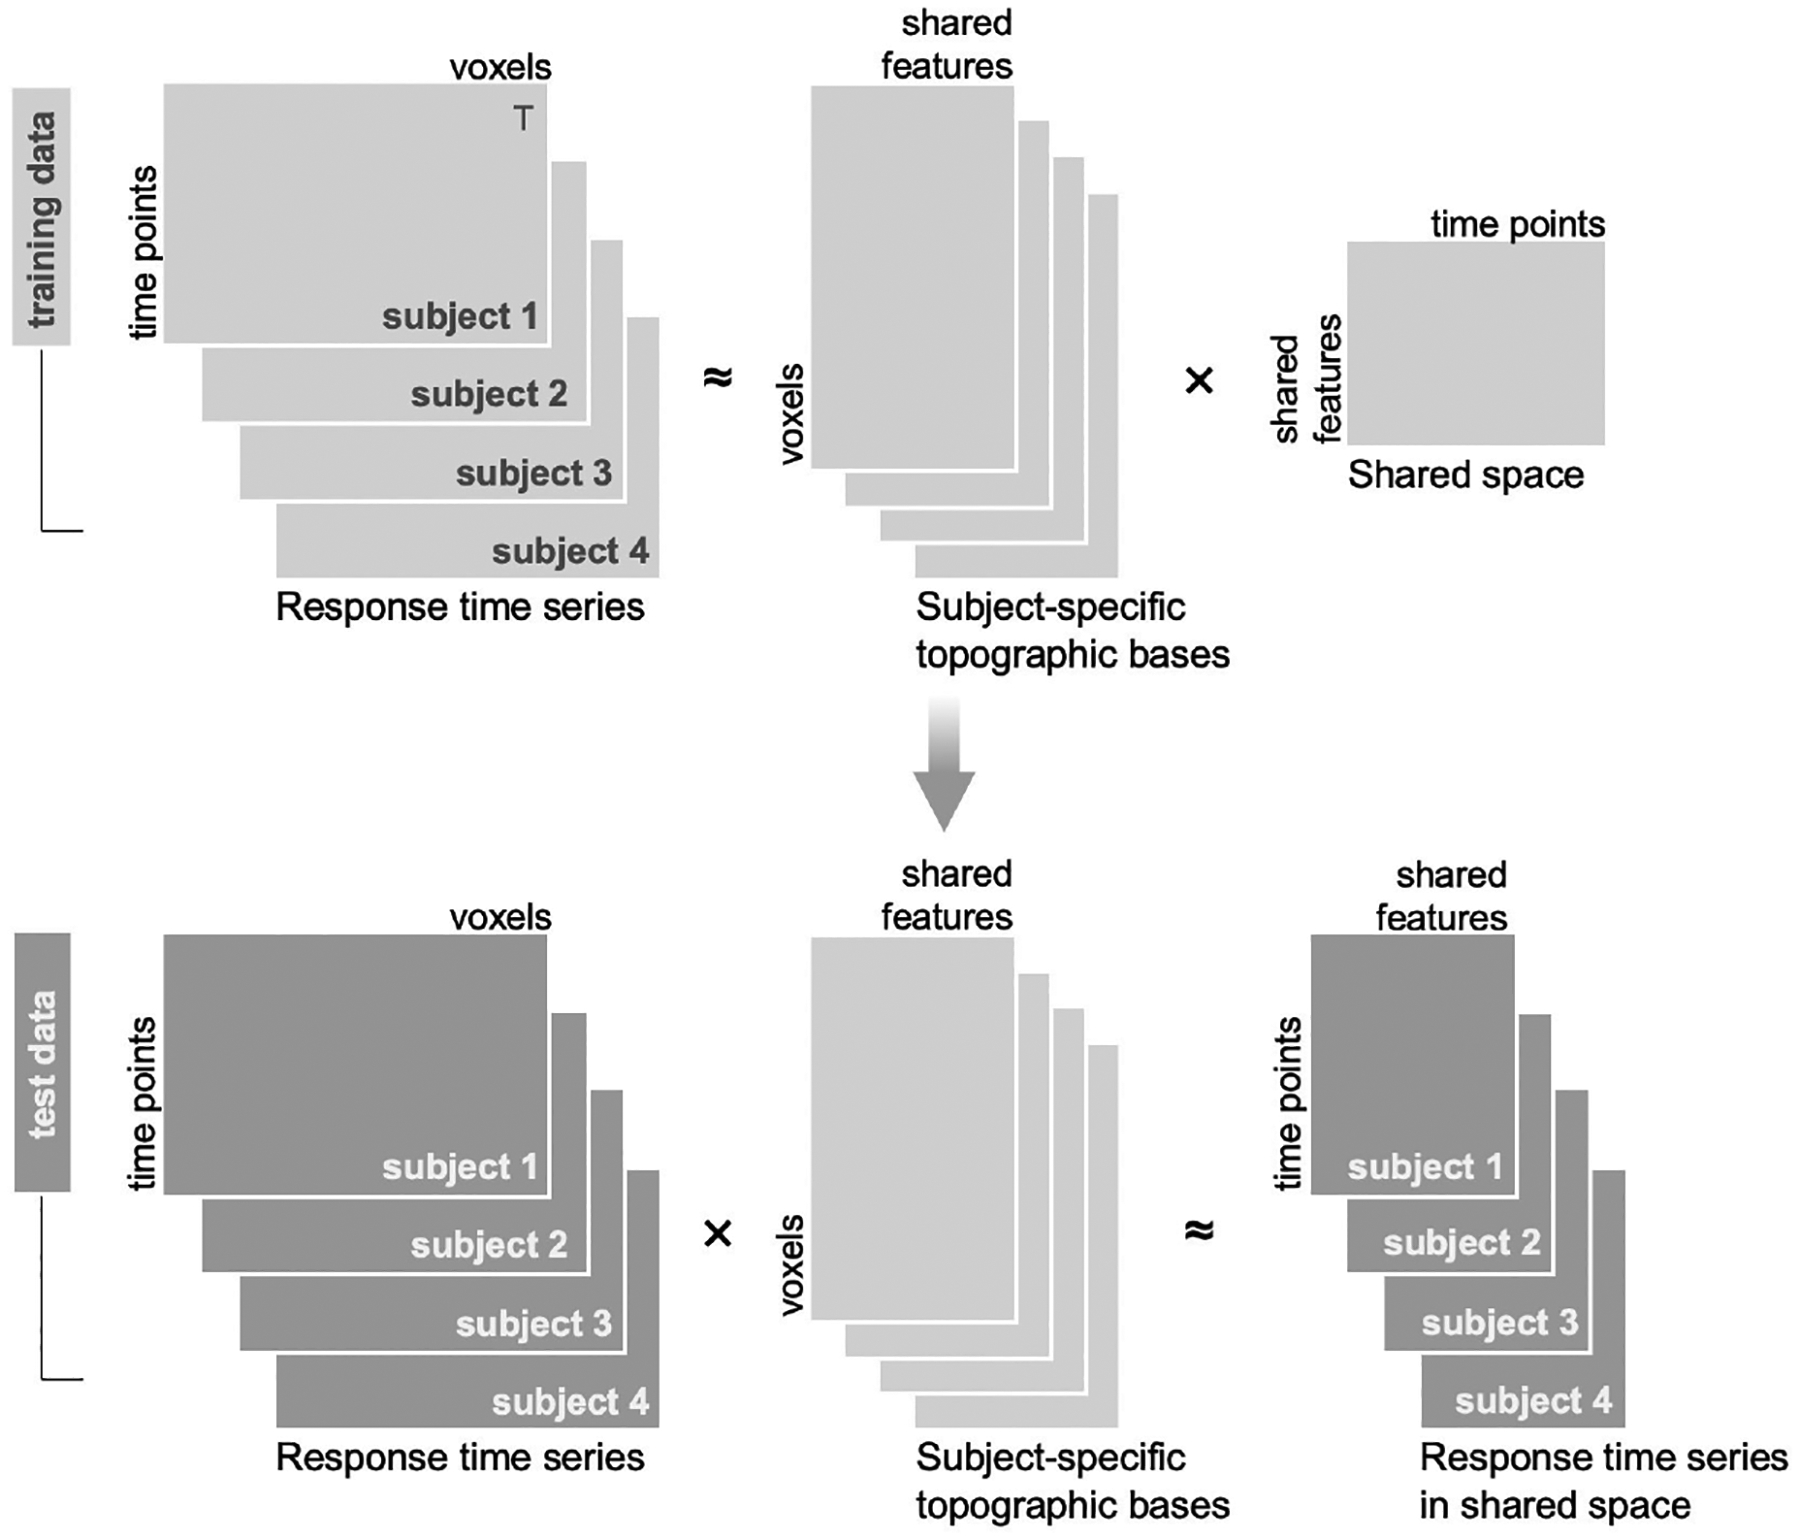
Schematic of the shared response model (SRM). Data are typically split into a training set (light gray) used to estimate the SRM and a test set (dark gray) used for evaluation. The SRM is estimated from response time series from the training set for multiple subjects (top left; transposed here for visualization). The multisubject response time series are decomposed into a set of subject-specific orthogonal topographic transformation matrices and a reduced-dimension shared response space. The learned subject-specific topographic bases can be used to project test data (bottom left) into the shared space. This projection functionally aligns the test data.