
Fig. 3.
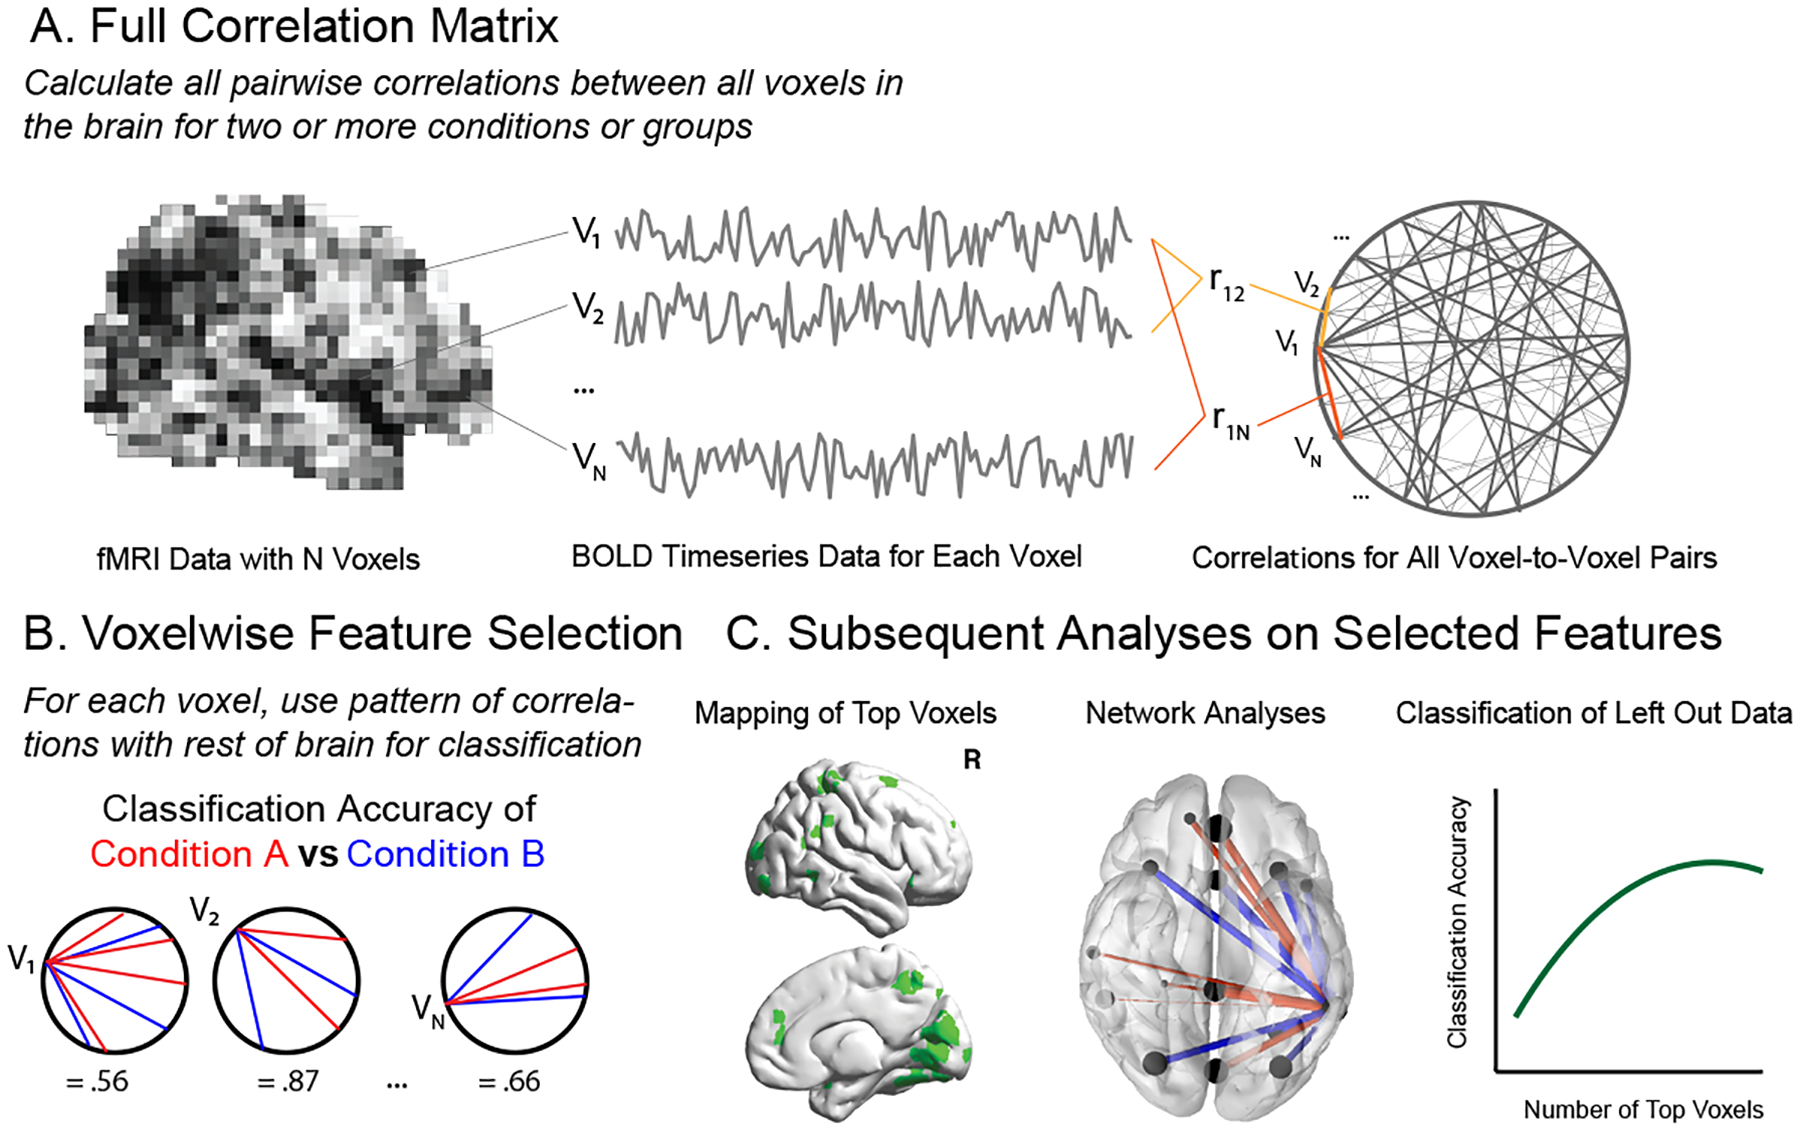
Full Correlation Matrix Analysis (FCMA). A. FCMA leverages several computing optimizations to permit calculation of full functional connectivity between all voxels in the brain. B. By default, FCMA then performs SVM classification on each voxel’s pattern of connectivity with the rest of the brain in order to assess how well each pattern differentiates two conditions or groups. C. The best performing voxels from B can then be used to guide additional analyses including visualizing/mapping top voxels, analysis of nodes and edges using graph theory-based metrics, and classification of patterns of connectivity from held-out data.