Fig. 4.

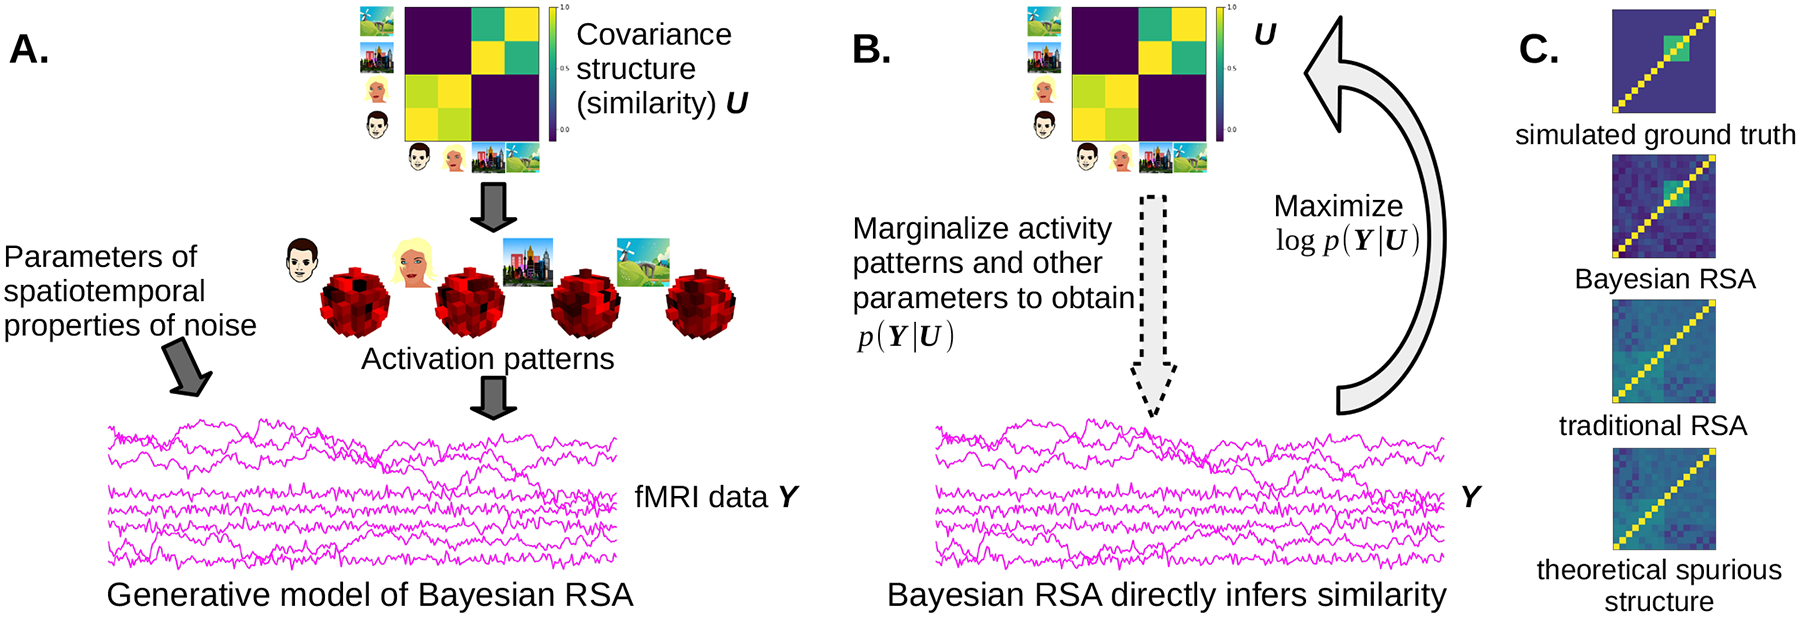
Overview of (G)BRSA. A. (G)BRSA assumes a hierarchical generative model for fMRI data, where a hypothetical covariance structure governs the distribution of response amplitudes of each voxel to different task conditions (here we take four images as an example), and the response amplitudes, in turn, contribute task-evoked responses to the fMRI data according to the design matrix. Other parameters determine the spatial and temporal properties of noise (and spontaneous activity). Arrows indicate causal relations in a probabilistic graphical model. B. (G)BRSA marginalizes out intermediate variables that contribute to fMRI data, making it possible to compute the log likelihood of the fMRI data Y given the covariance structure U (the arrow with dashed contour); the algorithm then finds U that maximizes this log likelihood (the solid arrow), which can be converted to a similarity matrix of activation patterns. C. BRSA significantly reduces bias (spurious similarity structure) compared to traditional RSA on a simulated dataset with 16 task conditions. The four figures are (from top to bottom) the ground truth similarity structure in the simulated data, similarity structure recovered by BRSA and traditional RSA, respectively, and the theoretically derived spurious structure arising from the interaction between fMRI noise and the design matrix (Figure C reproduced from [15]).
