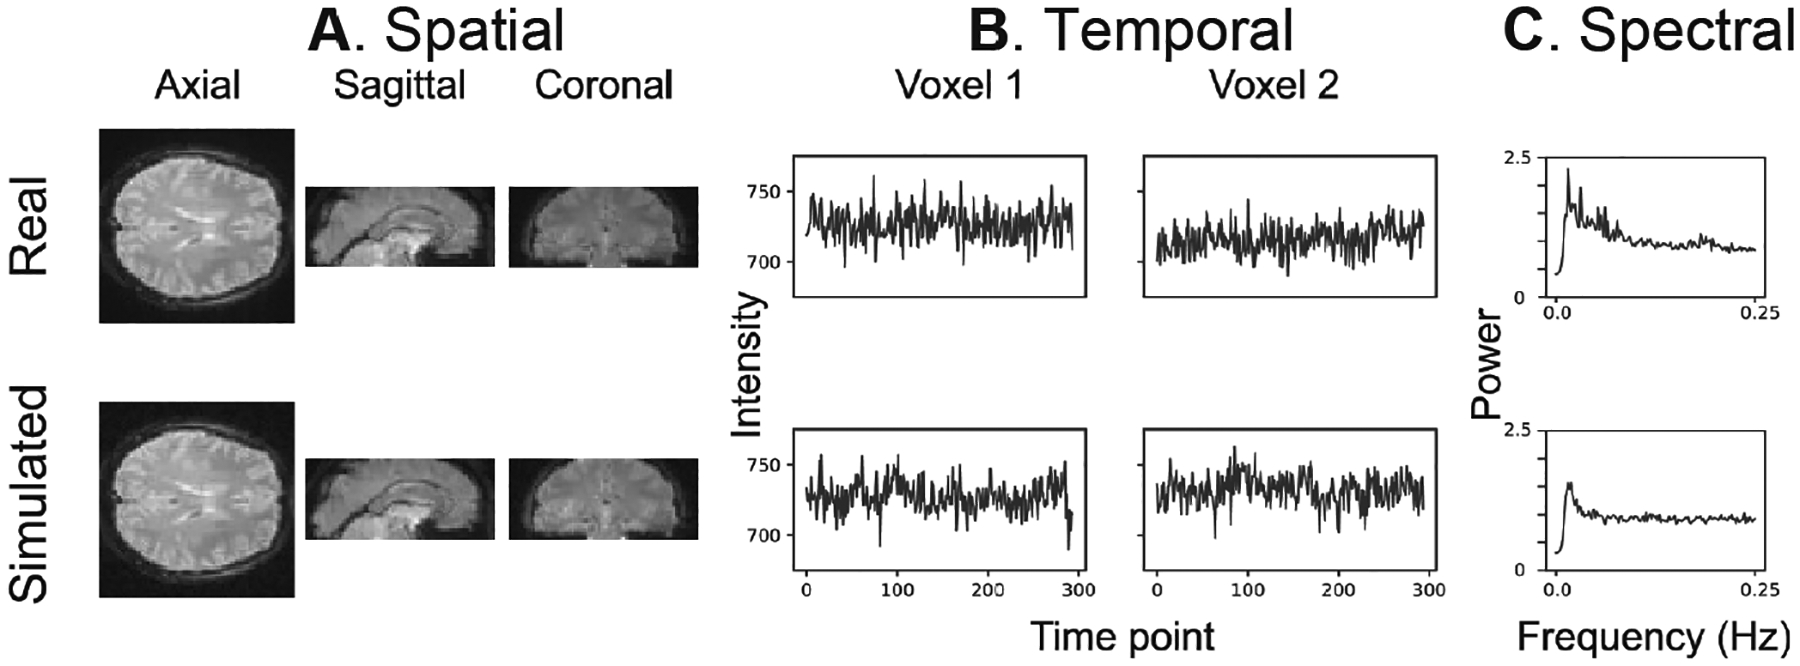
Fig. 8.

Example of the spatial and temporal structure of real and simulated data. The real data (top row) was input into fmrisim and produced simulated data (bottom row). A. It depicts the spatial structure of real data (top) and fitted simulated data (bottom). B. It shows the time course of sample voxels, and C. it shows the power spectra of a sample of high-pass filtered voxels. Reproduced from [23].
