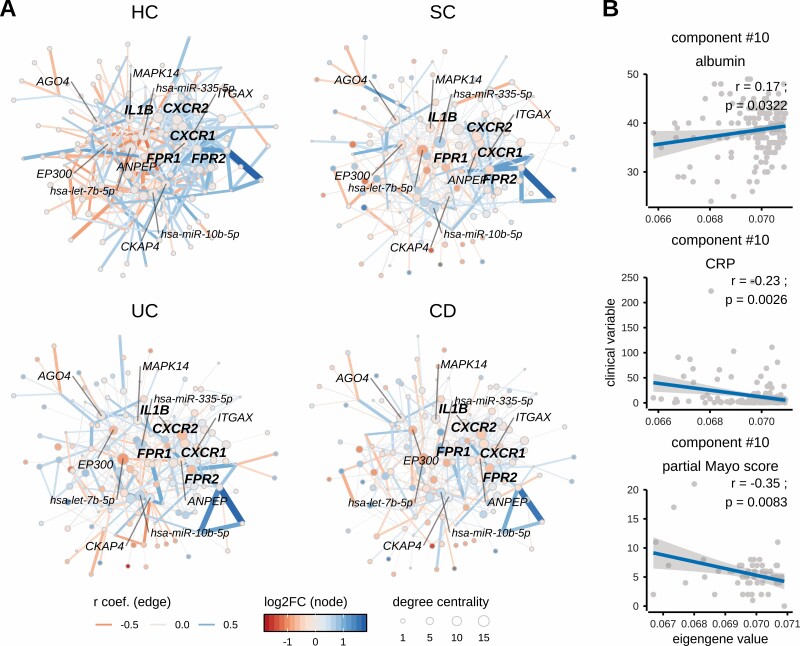
Figure 4.
Neutrophil activation-related co-expression module in different diagnoses and its correlation with clinical variables such as albumin and C reactive protein [CRP]. [A] Networks displaying co-expression module [component #10] activity among diagnoses [CD, UC, SC] and healthy controls [HC]. The neutrophil activation-related component module shows strong co-expression (note edge widths [thickness of line] between nodes) in healthy controls [HC], while co-expression of its member genes is reduced in inflammatory traits with the weakest co-expression in CD followed by UC and SC. The most central [hub] genes of this co-expression module are IL1B, CXCR1, CXCR2, FPR1 and FPR2 [highlighted in bold], whose differential expression during inflammation may disturb the co-expression of other member genes. Negative correlation-based integration of miRNA and their known target mRNA expression revealed miR-10b-5p, miR-335-5p and let-7b-5p as being the most interconnected miRNAs of co-expression module #10. The correlation coefficient [r] corresponds to co-expression activity [indicated by edge width], while the direction of correlation corresponds to edge colour. Nodes of the network represent genes [or miRNAs], the differential expression [log2FC] of which, compared to healthy controls [HC], is indicated by the colour gradient. The size of a node indicates its degree centrality, i.e. number of gene–gene interactions of a given gene [node]. The most central genes and miRNAs [hubs; having highest values of centrality degree] are annotated using gene or miRNA symbols. [B] Correlation of clinical variables [serum albumin concentration, serum and CRP concentration in CD and UC patients and partial Mayo score only in UC patients] and component [#10] eigengenes [summarized expression values, see Methods].

