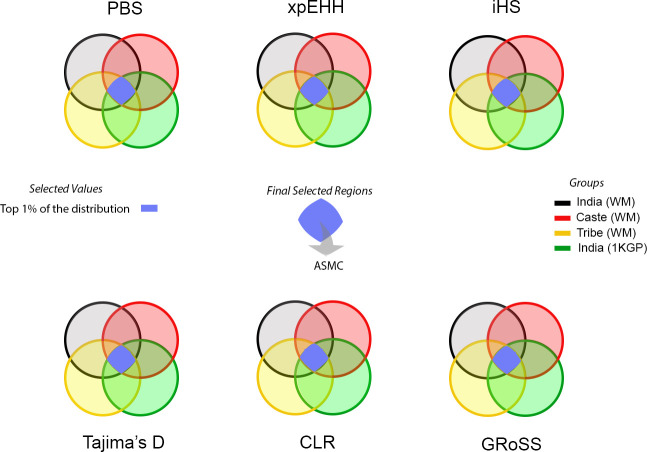
Fig 1. Schematic representation of the approach to identify putative selective regions.
We applied six different methods to identify outliers (top 1% results) and selected regions that were observed in all population groups and were outliers for at least two independent methods. Additionally, we performed analyses using a novel coalescence-based method implemented in the program ASMC.

