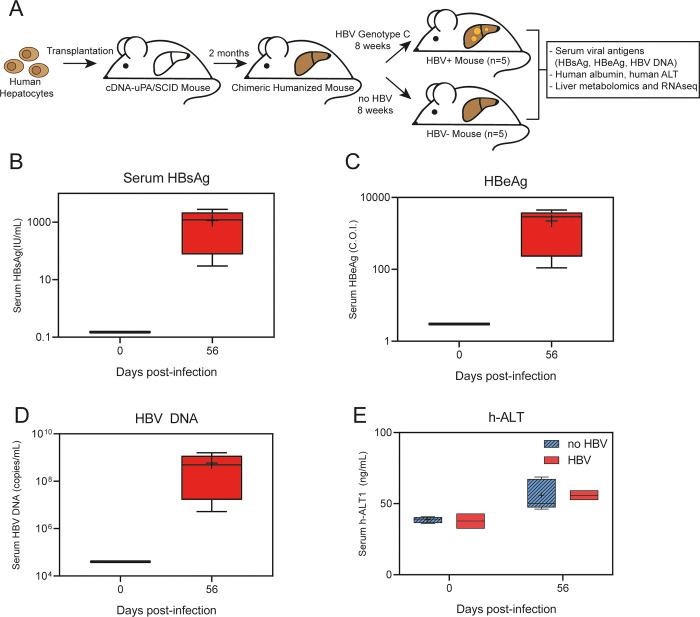
Fig 1. Chimeric humanized mouse model to identify host factors and pathways modulated by HBV infection.
(A) Schematic overview of the study design and samples analyses. (B-D) Levels of serum viral markers at 0- and 56-days post HBV infection: HBsAg (B), HBeAg (C) and HBV DNA (D). (E) Serum levels of h-ALT in HBV-infected and non-infected mice measured at 0- and 56-days post- infection. Data is shown as box plots; the box represents the upper and lower quartile, error bars denote the max and min of distribution, the ‘+’ sign represents the mean value and the horizontal line indicates the median value.

