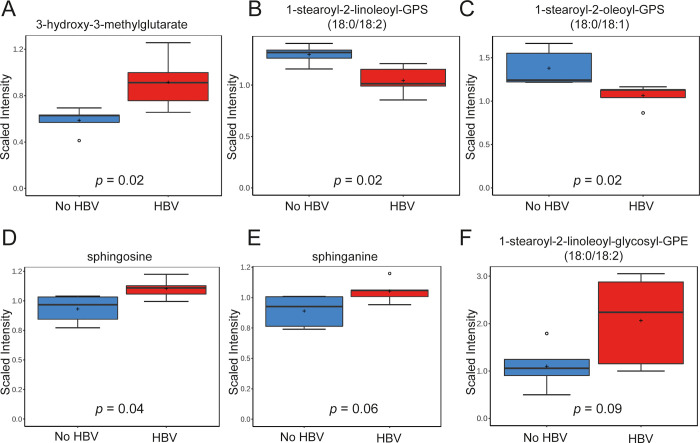
Fig 3. Metabolomic profiling of humanized chimeric mouse livers shows dysregulation in the levels of metabolites within mevalonate, phospholipid and sphingolipid pathways.
Hepatic levels of metabolites from HBV-infected and non-infected mice within (A) mevalonate pathway (3-hydroxy-3-methylglutarate); (B-C) phospholipid pathway: 1-stearoyl-2-linoleoyl-GPS (18:0/18:2) (B) and 1-stearoyl-2-oleoyl-GPS (18:0/18:1) (C); (D-E) sphingolipid pathway: sphingosine (D) and sphinganine (E); (F) plasmalogens glycosyl-PEs (1-stearoyl-2-linoleoyl-glycosyl-GPE (18:0/18:2)). Data is scaled such that the median value measured across all samples was set to 1.0. Data is shown as box plots; the box represents the upper and lower quartile, error bars denote the max and min of distribution, the ‘+’ sign represents the mean value and the horizontal line indicates the median value.

